What if your current fitness plan overlooks a key factor in achieving lasting health? Many assume hitting a number on the scale guarantees wellness, but body composition and individual health metrics play a far bigger role. This guide dives into how an ideal weight for height calculator helps you cut through the noise and focus on what truly matters.
Understanding your body’s unique needs starts with reliable tools. These calculators compare formulas like Devine and Hamwi, which account for age, gender, and frame size. Instead of generic advice, you’ll get tailored insights to align your diet, exercise, and wellness strategies.
Why rely on guesswork when data-driven methods exist? Whether planning weight loss or optimizing muscle gain, this guide breaks down how to interpret results and apply them effectively. Let’s explore the science behind the numbers—and how they empower smarter choices.
Key Takeaways
- Calculators use multiple formulas (like Devine and BMI) for accurate results.
- Age, gender, and body composition influence your ideal range.
- Tailored data helps create effective diet and fitness plans.
- Comparing formulas reduces reliance on one-size-fits-all metrics.
- Understanding results supports long-term health goals.
Understanding the Basics of Ideal Weight
Your body’s blueprint isn’t a random number—it’s a balance between fat, muscle, and bone. Medical professionals use healthy weight ranges to assess risks for conditions like diabetes or heart disease. These benchmarks help create personalized strategies rather than chasing generic goals.
Why Numbers Matter
The concept of ideal body weight originated in 1974 with Dr. Devine’s formula for medication dosing. Today, multiple methods exist:
| Formula | Year | Gender Focus | Equation |
|---|---|---|---|
| Devine | 1974 | Both | 50 kg + 2.3 kg/inch over 5′ |
| Hamwi | 1964 | Men/Women | Men: 48 kg + 2.7 kg/inch Women: 45.5 kg + 2.2 kg/inch |
| Robinson | 1983 | Adjusted | Men: 52 kg + 1.9 kg/inch Women: 49 kg + 1.7 kg/inch |
“These formulas are tools, not verdicts. Muscle mass and bone density change what ‘healthy’ looks like.”
Beyond the Math
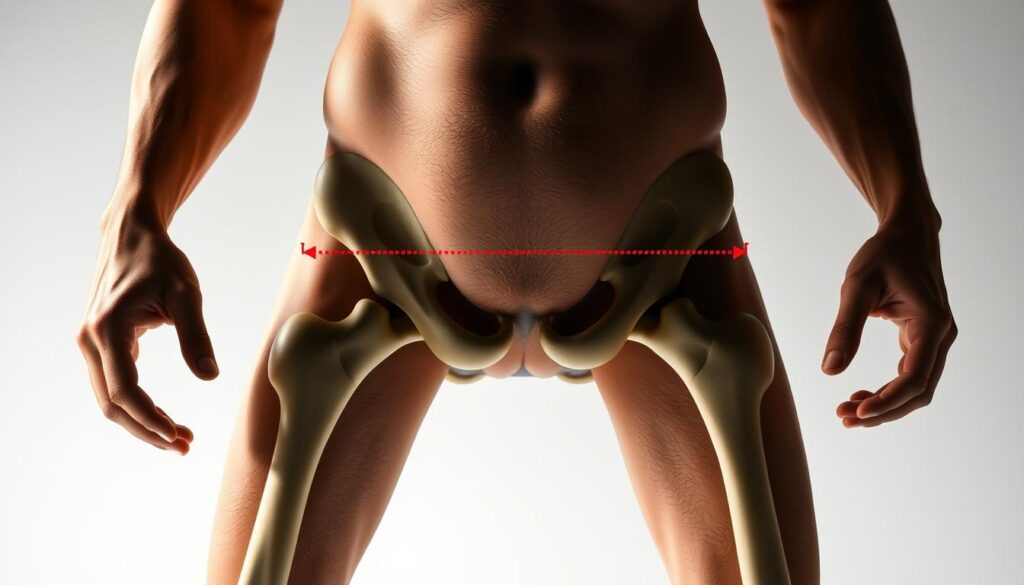
While BMI (body mass index) remains popular, it doesn’t distinguish fat from muscle. A 2022 study found athletes often register as “overweight” despite low body fat. Measurements work best when combined with waist-to-hip ratios or DEXA scans.
Key limitations of traditional methods:
- Ignore metabolic health markers
- Use outdated population data
- Overlook genetic factors
Always pair calculations with a healthcare provider’s insight. Your age, activity level, and medical history refine what numbers mean for you.
Using the Ideal Weight for Height Calculator
Ever wondered how professionals determine personalized health benchmarks? Modern tools analyze multiple variables to create actionable insights. This section walks through operating these systems efficiently while interpreting outcomes with clarity.
Step-by-Step Guide to Inputting Your Data
Start by selecting measurement units—most calculators offer both imperial and metric options. Enter your biological sex first, as formulas like Devine and Hamwi adjust ranges based on gender. Next, input your current measurements:
- Height (feet/inches or centimeters)
- Weight (pounds or kilograms)
- Age (optional for some tools)
Advanced versions let you set target BMI values. Double-check entries—a 2023 NIH study found 23% of users make input errors affecting results.
How Results Are Calculated and Displayed
The tool cross-references your data against four key formulas:
| Method | Variables | Output Type |
|---|---|---|
| Devine | Height, gender | Single value |
| Hamwi | Frame size | Range |
| Robinson | Age adjustment | Adjusted range |
Results typically appear as color-coded charts comparing your current metrics to healthy ranges. Some platforms include graphs showing how muscle mass or body fat percentage impacts outcomes.
For accurate calculations, measure yourself at the same time daily. If numbers seem inconsistent, recalibrate your scale or try a different browser. Remember—these results guide decisions but don’t replace medical advice.
Key Factors Influencing Ideal Weight
Your unique physiology acts like a fingerprint—no two bodies share identical requirements. Three elements particularly shape personalized health benchmarks: biological sex, structural proportions, and life-stage changes.
Biological Sex and Structural Proportions
Men and women store fat differently due to hormonal influences. Research shows male bodies typically carry 3-5% less essential fat than female bodies. This impacts healthy ranges—a 5’9″ male might thrive at 168 lbs, while a female of the same height could target 155 lbs.
Frame size matters too. Measure your wrist circumference to determine if you have a small, medium, or large build:
| Frame Size | Female Wrist | Male Wrist |
|---|---|---|
| Small | < 6.25″ | < 7.25″ |
| Medium | 6.25″-6.75″ | 7.25″-7.75″ |
| Large | > 6.75″ | > 7.75″ |
Life Stage and Tissue Composition
After 30, adults lose 3-8% of muscle mass per decade. Simultaneously, the spine compresses—people shrink 0.5-1 inch by age 70. “Strength training becomes non-negotiable to maintain metabolic rate,” notes Dr. Ellen Torres, NASM-certified trainer.
Key considerations across ages:
- Post-menopausal women gain abdominal fat faster
- Men experience sharper testosterone declines after 40
- Bone density peaks at 35, affecting overall body mass
These factors explain why a 160-lb 25-year-old athlete differs from a sedentary 55-year-old with identical measurements. Adjust targets using DEXA scans or waist-to-height ratios for precision.
Interpreting Results and Maintaining a Healthy Weight
Numbers on a chart only matter if you know how to use them. Modern tools map your metrics to actionable insights—but interpretation determines their real-world impact. Let’s break down how to translate data into sustainable habits.
Understanding BMI and Healthy Weight Ranges
The body mass index categorizes results into four tiers. According to CDC guidelines:
| BMI Range | Category |
|---|---|
| 18.5–24.9 | Healthy |
| 25–29.9 | Overweight |
| 30+ | Obese |
Tools often display your ideal body weight as a range correlating to a healthy BMI range. For example, a 5’7″ adult might see 121–158 lbs linked to BMI 19–25. Muscle-heavy individuals may fall outside these bounds—a key reason to pair metrics with body fat tests.
Using the Calculator to Guide Diet and Lifestyle
If results suggest adjustments, start with small changes. Swap sugary drinks for water, add 30-minute walks, or track protein intake. Studies show losing 1–2 lbs weekly creates lasting results versus crash diets.
Track progress using the tool’s chart feature. Monthly weigh-ins plotted against your target range reveal trends. Notice a plateau? Adjust calorie intake or strength training frequency.
“Tools provide direction, but your daily choices steer the journey. Combine data with consistency.”
Always discuss major shifts with a healthcare provider. They’ll assess if your plan aligns with blood work, sleep patterns, and medical history. Remember—management isn’t about perfection, but sustainable balance.
Conclusion
Your journey to better health starts with understanding, not just numbers. Tools like the BMI calculator for men blend science with practicality, offering benchmarks rooted in decades of research. Formulas like Devine’s provide starting points, but your age, muscle composition, and frame size shape what’s truly achievable.
Combine multiple metrics—body mass index, waist ratios, and medical advice—for a complete picture. Women and men often need different targets due to hormonal influences. Athletes or older adults may require adjustments beyond standard charts.
Use these insights to craft sustainable habits. Pair your results with nutrient-rich meals and strength training. Always consult professionals to align goals with blood work or metabolic needs.
Revisit this guide when refining your strategy. Knowledge evolves, and so should your approach. Data-driven choices, not fleeting trends, build lasting wellness.


