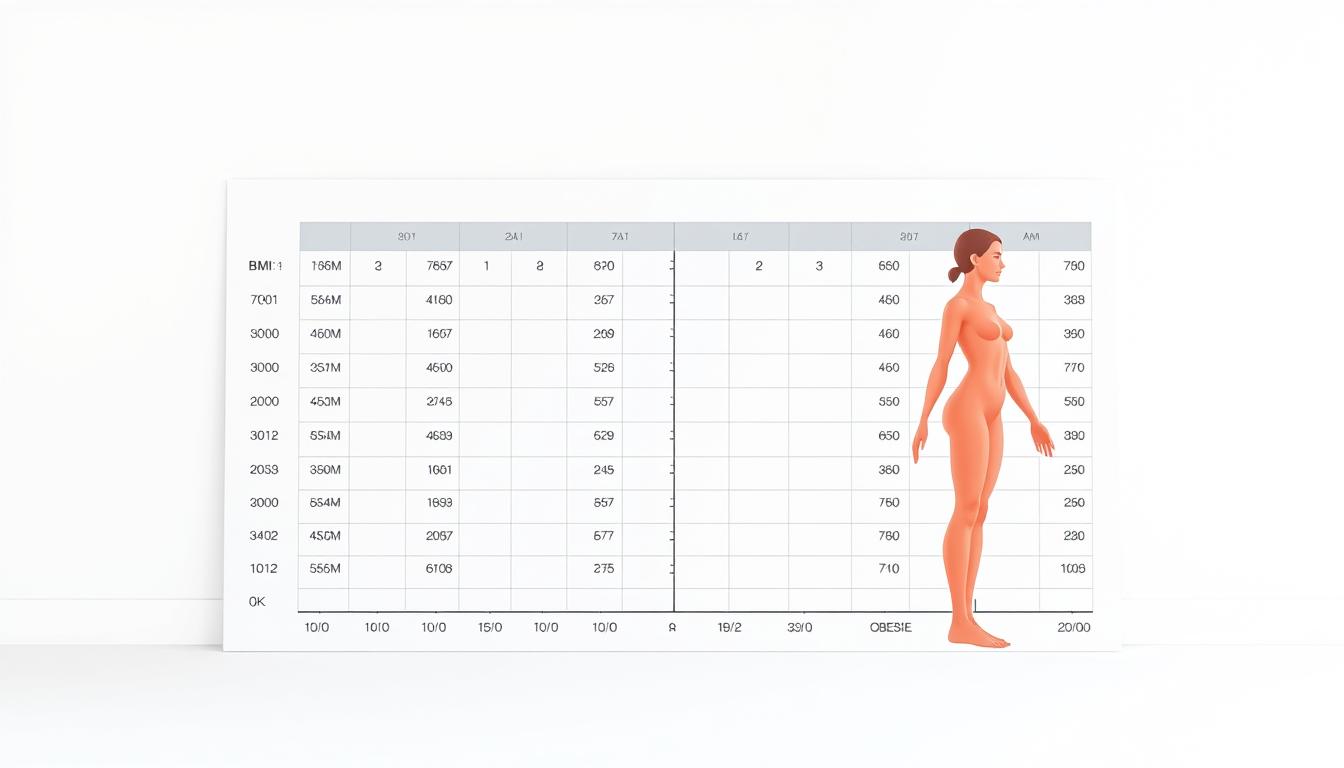
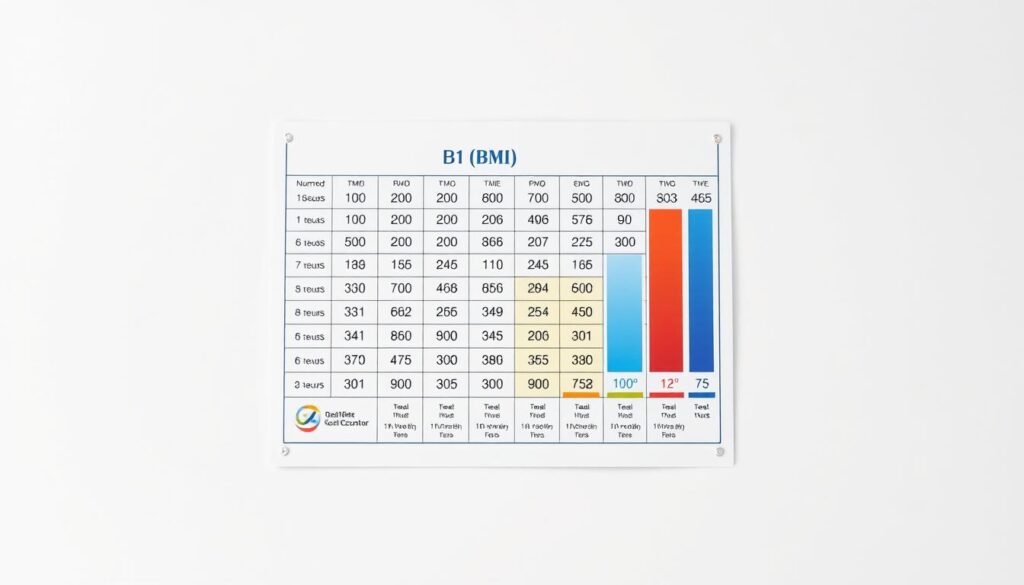
What if tracking just two numbers could help you avoid serious health risks? The height weight obesity chart is a widely used tool that offers a snapshot of your body’s relationship to potential health concerns. By pairing these measurements with BMI (Body Mass Index), experts identify patterns linked to conditions like heart disease or diabetes.
Medical organizations like the CDC and American Cancer Society emphasize the value of these charts. They provide structured guidance to assess whether someone falls into a healthy weight range or faces elevated risks. While not a full diagnosis, they’re a starting point for proactive health decisions.
This guide simplifies how to interpret these tools. You’ll learn to connect BMI categories to actionable steps, backed by data from trusted sources. We’ll also explore why body composition matters more than numbers alone—and how to use this knowledge effectively.
Key Takeaways
- The height weight obesity chart helps identify potential health risks through simple measurements.
- BMI categories are standardized by health authorities like the CDC.
- Combining BMI with other metrics offers a clearer picture of overall wellness.
- Expert data from Medical News Today and others ensures reliable insights.
- Understanding these tools empowers better weight management strategies.
Introduction to Body Measurements and Health
Body measurements are more than numbers—they’re windows into long-term wellness. Health professionals rely on basic metrics like body weight and stature to evaluate risks tied to chronic diseases. These assessments form the foundation of personalized care plans, especially for adults navigating age-related changes.
Importance of Height and Weight in Health Assessments
Tracking physical metrics helps identify patterns linked to conditions like diabetes or hypertension. For example, the CDC notes that body mass index (BMI) categorizes individuals into four groups: underweight, healthy, overweight, and obese. Age and sex also play roles—muscle mass declines with time, while hormonal shifts affect fat distribution.
Overview of BMI and Other Health Metrics
BMI is calculated by dividing weight in kilograms by height in meters squared. However, Medical News Today warns it doesn’t distinguish muscle from fat. A 200-pound athlete and sedentary person may share the same BMI but face vastly different health outcomes. This gap highlights why metrics like body fat percentage offer deeper insights.
Additional tools like waist-to-hip ratios or DEXA scans address BMI’s blind spots. For instance, visceral fat around organs raises heart disease risks, even if BMI falls within “normal” ranges. Combining quantitative data with lifestyle context creates a balanced view of well-being.
“BMI is a starting point, not a finish line—individual factors like bone density or fitness habits matter just as much.”
How to Use a height weight obesity chart Effectively
Tracking physical metrics becomes actionable when you know how to interpret them correctly. These charts simplify complex health data into visual guides, helping identify patterns that might otherwise go unnoticed.
Step-by-Step Guide to Reading the Chart
- Measure consistently: Use calibrated tools on a flat surface. Check person weight in the morning before eating for accurate comparisons.
- Calculate BMI: Divide pounds by inches squared, then multiply by 703. Online calculators automate this, but manual math ensures understanding.
- Match your numbers: Locate your height weight intersection on the chart. This reveals your BMI category instantly.
| BMI Range | Category | Health Risk |
|---|---|---|
| 18.5-24.9 | Healthy | Low |
| 25-29.9 | Overweight | Moderate |
| 30+ | Obesity | High |
Note that muscle mass skews results—athletes may show “overweight” BMI despite low body fat. Conversely, a “normal” BMI with excess fat around organs still poses risks.
Medical News Today advises pairing chart data with waist measurements. This dual approach helps a person address hidden dangers like visceral fat. Regular tracking builds awareness, turning numbers into preventive strategies.
Factors Influencing Healthy Weight and Obesity
Why do two people with identical BMI scores face vastly different health outcomes? The answer lies in variables like age, biological sex, and muscle mass. These factors reshape how we interpret standard health metrics, turning generic numbers into personalized insights.
Role of Age, Sex, and Muscle Mass
Muscle weighs more than fat—a fact that skews BMI results for athletes or physically active individuals. The CDC reports that men often show higher mass in muscle-dense areas, while women typically store more fat. This biological difference explains why sexes may fall into separate BMI categories despite similar health profiles.
Age compounds these variations. After 30, adults lose 3-8% of muscle per decade, altering body composition. Children face different standards entirely—growth charts replace BMI index calculations until age 20. Pediatricians track percentiles instead of fixed ranges to account for developmental changes.
Understanding BMI Ranges and Health Risks
Standard BMI calculator results group individuals into four classifications. However, these ranges don’t distinguish between fat and muscle. A 180-pound bodybuilder and sedentary office worker could share the same BMI but face opposite heart disease risks.
| BMI Category | Weight Range (lbs) | Health Considerations |
|---|---|---|
| Underweight | <18.5 | Nutrient deficiencies |
| Healthy | 18.5–24.9 | Optimal function |
| Overweight | 25–29.9 | Moderate risk factors |
| Obesity | 30+ | Chronic disease likelihood |
The American Cancer Society emphasizes that body composition analysis—like waist measurements—adds critical context. For example, visceral fat around organs elevates heart risks even with “normal” BMI. Always pair chart data with body composition analysis for accurate assessments.
“BMI provides a population-level snapshot but requires individual context for accurate assessments,” notes the CDC.
Children’s growth spurts further complicate interpretations. A sudden 10-pound gain might reflect healthy development rather than excess fat. Tailored tools like pediatric calculator systems account for these nuances, proving one-size-fits-all approaches often miss the mark.
Practical Tips for Maintaining a Healthy Weight
Building sustainable habits is key to long-term wellness. Simple adjustments to diet and activity levels can reshape body composition while lowering risks tied to chronic disease. Let’s explore strategies backed by the CDC and Medical News Today to help you stay on track.
Fueling Progress Through Nutrition and Movement
Start with small, consistent changes. Swap sugary drinks for water, and prioritize lean proteins like chicken or beans to support muscle growth. Pair this with 150 minutes of weekly activity—walking, cycling, or strength training—to boost metabolism.
| Activity Type | Weekly Goal | Benefits |
|---|---|---|
| Cardio | 75 minutes vigorous | Heart health |
| Strength Training | 2-3 sessions | Muscle retention |
| Flexibility | Daily stretches | Injury prevention |
Track progress using a BMI calculator every 4-6 weeks. This tool helps identify trends, especially when paired with waist measurements. For example, losing 2 inches around your midsection can significantly reduce heart disease risks, even if the scale doesn’t budge.
“Consistency beats intensity—focus on gradual improvements rather than rapid changes,” advises a Medical News Today nutritionist.
Tailor your plan to personal factors like age or fitness level. Older adults might prioritize balance exercises, while younger individuals could focus on muscle-building. Explore BMI weight loss strategies for customized guidance on refining body composition safely.
Conclusion
Understanding your body’s signals starts with simple tools like the height weight obesity chart. Paired with BMI calculations, it offers a quick snapshot of potential risks, such as heart disease, while guiding activity and nutrition choices. Health groups like the CDC stress that numbers like BMI 18.5 (healthy) or BMI 29.9 (overweight) are screening tools—not final verdicts.
Factors like age, muscle mass, and lifestyle shape results. For example, children and teens require growth charts instead of adult metrics. A high BMI might reflect muscle in athletes, while a less 18.5 score could signal undernutrition.
Combine BMI with waist measurements or body fat tests for accuracy. This reduces risk developing chronic issues. Use a BMI calculator monthly and adjust habits based on trends. Always consult a professional if concerned.
Your health journey thrives on informed choices. Track progress, stay active, and prioritize holistic assessments. Small steps today build lasting wellness tomorrow.


