What if the numbers on your scale don’t tell the whole story about your well-being? For women over 65, understanding body composition matters far more than chasing a single “ideal” number. Research from the NIH reveals that body mass index (BMI) guidelines shift with age—what’s healthy at 40 might not apply at 70.
This guide simplifies evidence-based strategies for older adults. You’ll learn how factors like muscle mass, waist size, and bone density impact your health risks. For example, a 5’4″ woman weighing 150 pounds might fall into a healthy range if she maintains strength through regular activity.
Charts tailored for older women—like those from the National Institutes of Health—consider these nuances. They combine BMI ranges with waist circumference data to provide a clearer picture. Studies show that a waist measurement over 35 inches increases heart disease risk, even with a “normal” BMI.
Key Takeaways
- BMI guidelines adjust with age for women over 65
- Waist circumference is a critical health marker
- Muscle mass preservation impacts weight metrics
- NIH charts integrate height, weight, and age data
- Practical diet and activity tips enhance results
By blending science with actionable steps, this resource helps you navigate healthy aging confidently. Let’s explore how to interpret these tools—and use them to thrive.
Understanding the Weight Chart for Seniors Female
Health assessments for older women need more than just numbers on a scale. Specialized tools like the weight chart for seniors female combine multiple metrics to evaluate wellness accurately. These resources account for natural changes in body composition and metabolic shifts that occur with aging.
What the Weight Chart Represents
This chart integrates three core elements: BMI ranges, waist measurements, and muscle-to-fat ratios. Unlike standard guidelines, it uses age-adjusted thresholds from organizations like the NIH. For example, a 70-year-old woman with a BMI of 27 might fall into a healthy category if her waistline stays below 35 inches.
Research shows waist size predicts health risks better than BMI alone. A CDC study found women with waistlines exceeding 35 inches had 50% higher cardiovascular risks. The chart’s dual focus on body mass index and abdominal fat helps users spot potential issues early.
Key Benefits for Senior Women
Regular use of this tool supports:
- Early detection of obesity-related conditions
- Preservation of bone density through targeted nutrition
- Improved mobility via muscle mass maintenance
As one geriatric specialist notes: “Waist measurements reveal what BMI hides—the dangerous visceral fat surrounding organs.” By tracking both metrics, women can make informed decisions about diet and activity levels.
These charts also simplify progress tracking. Measuring in consistent units (inches and pounds) creates reliable baseline data. Over time, trends become clearer than single measurements—a crucial advantage for managing age-related changes.
Calculating and Interpreting BMI in Senior Women
How does body mass index translate to real health insights for older adults? While BMI remains a common screening tool, its interpretation requires age-specific adjustments. The standard formula still applies: weight in pounds divided by height in inches squared, multiplied by 703. For example, a 5’5″ woman weighing 150 pounds calculates her BMI as (150 / 4225) x 703 = 24.9.
Age Adjustments Matter
Muscle loss and shifting fat distribution alter BMI’s meaning after 65. Research in the Journal of Gerontology shows seniors with a BMI of 25-27 often have lower mortality risks than those in “normal” ranges. This obesity paradox highlights why waist measurements provide critical context—a 35-inch threshold set by the CDC signals increased heart disease risk regardless of BMI.
Beyond the Numbers
Consider two women with identical BMIs of 26. One has a 32-inch waist and regular strength training routine, while the other measures 38 inches with limited mobility. “The tape measure reveals what BMI obscures,” explains a Centers for Disease Control report. Digital tools like smart scales that track both metrics help spot trends. Apps such as MyFitnessPal simplify monthly check-ins.
Regular monitoring matters because body composition shifts gradually. Pairing BMI with waist checks creates a clearer picture—one that guides smarter nutrition and activity choices for lasting vitality.
Using the Weight Chart for Seniors Female to Set Healthy Goals
Translating data into action empowers older women to prioritize wellness effectively. Start by locating your height on the chart and comparing it to age-adjusted BMI zones. A 5’3″ woman might see a healthy range between 125-145 pounds—but this shifts if she maintains above-average muscle mass through resistance training.
How to Read and Apply the Chart Data
First, cross-reference your BMI with waist measurements. Research shows combining these metrics reduces heart disease risk by 34% in postmenopausal women. For example:
- BMI 23-27 + waist ≤35 inches = maintain current habits
- BMI ≥28 + waist ≥36 inches = consult a nutritionist
The American Journal of Clinical Nutrition notes: “Small BMI reductions of 2-3 points significantly lower blood pressure in adults over 65.”
Adjusting Diet and Exercise According to BMI
If your numbers suggest changes, try these effective body composition strategies:
- Swap 200 daily calories from carbs to protein to preserve muscle
- Add two weekly strength sessions targeting major muscle groups
A Johns Hopkins study found older adults who lost 5-7% of body weight improved metabolic health markers by 41%. Always pair adjustments with monthly measurements—body composition changes gradually after 65.
Understanding Body Composition and Related Health Risks
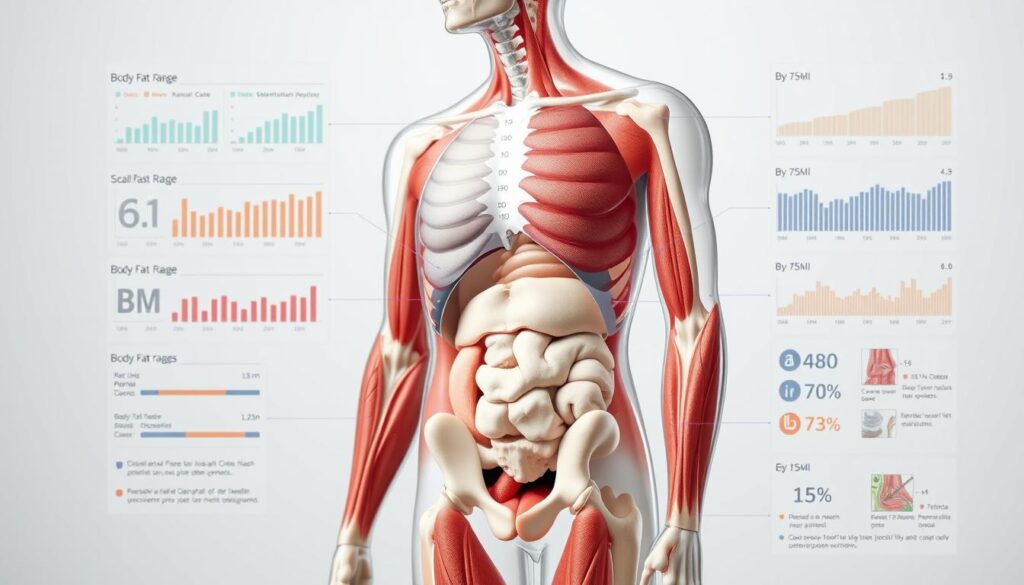
Your body’s makeup—not just pounds—determines vitality in later years. Body composition measures fat versus muscle, bones, and organs. For older women, this balance predicts wellness better than any scale number.
Fat vs. Muscle: Hidden Health Signals
Excess body fat, especially around the abdomen, strains the heart and metabolism. The NIH reports women with over 35% body fat face 3x higher diabetes risks. Meanwhile, muscle loss after 65—called sarcopenia—reduces mobility and bone strength.
Waist measurements over 35 inches signal dangerous visceral fat. “Abdominal fat releases inflammatory chemicals that damage blood vessels,” notes a Verywell Health analysis. Pair this with elevated blood pressure, and stroke risk jumps 48%.
Surprisingly, some extra pounds might help. The obesity paradox shows slightly higher BMIs (25-27) sometimes protect against frailty. But this doesn’t apply to those with large waistlines or low activity levels.
Track changes using:
- Smart scales measuring fat percentage
- Monthly waist checks with a cloth tape
- Blood pressure monitors approved by the CDC
Focusing on body composition helps women address risks before symptoms appear. Small improvements—like adding protein or walking daily—create lasting benefits.
Step-by-Step Guide to Measuring and Monitoring Progress
Accurate measurements form the foundation of effective health management. Older adults benefit from simple, consistent tracking methods that account for natural bodily changes. Let’s break down the process into actionable steps.
Accurate Techniques for Height and Weight Measurements
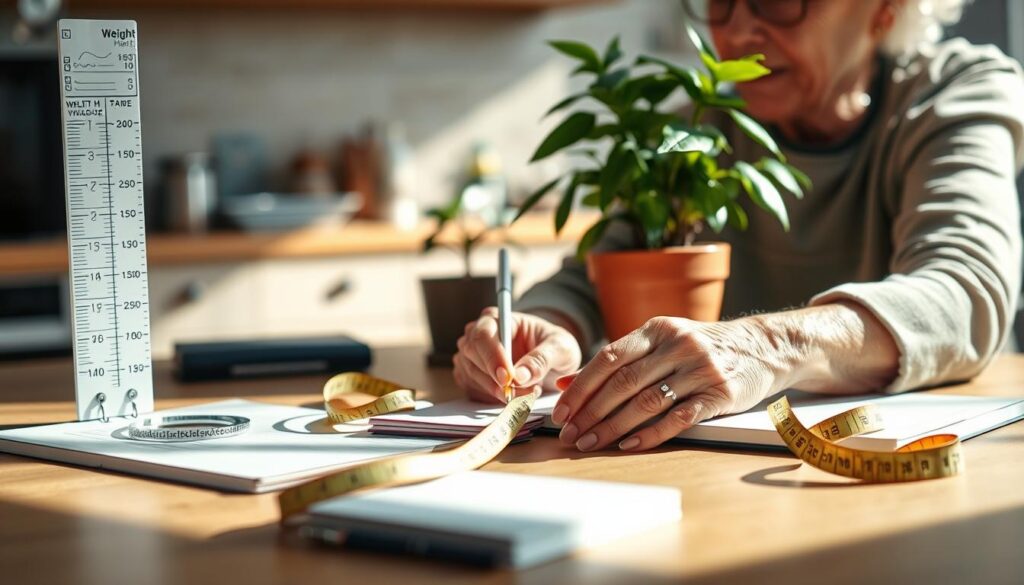
Use a calibrated digital scale with a height rod, like the Health-o-Meter 500KL. Measure at the same time daily—morning works best—wearing similar clothing. Stand straight against the wall for height checks, heels together and eyes forward.
Record numbers immediately in a dedicated journal or app. Studies show consistent tracking improves goal achievement by 27% in adults over 65. Pair this with waist circumference checks: place the tape measure above your hipbones, exhale normally, and note the number without pulling tight.
Tracking Changes Over Time Effectively
Compare measurements monthly rather than daily. Look for trends over 3-6 months, as short-term fluctuations often mislead. A 2-3 pound shift might reflect hydration changes, while sustained 5-pound differences warrant attention.
Integrate multiple health indicators:
- Blood pressure readings
- Walking endurance
- Clothing fit changes
Utilizing Digital Tools and Scales
Modern devices simplify monitoring. Smart scales sync with apps to track body mass index, muscle percentage, and hydration levels. The NIH recommends models with voice-read features for visually impaired users.
Calibrate tools quarterly using known weights. For height accuracy, mark your wall and measure annually—bone density changes can alter stature by 0.5 inches per decade after 70. Cross-reference your data with BMI chart analysis to contextualize results within your age group.
Practical Lifestyle Tips for Older Adults
Small daily choices create lasting impacts on well-being after 65. Focus on sustainable habits that enhance body composition while supporting mobility and energy levels. Start with these two pillars of healthy aging.
Smart Eating Patterns
Prioritize protein at every meal to combat age-related muscle loss. A Johns Hopkins study found adults consuming 25-30 grams of protein per meal maintained 40% more lean mass. Try Greek yogurt at breakfast, grilled chicken at lunch, and lentils at dinner.
Swap empty calories for nutrient-dense options:
- Replace chips with roasted chickpeas
- Choose whole-grain toast over white bread
- Opt for baked salmon instead of fried meats
Measure portions using your hand—palm-sized proteins, fist-sized veggies. This method simplifies calorie management without strict counting.
Movement That Matters
Build strength through resistance bands or light weights twice weekly. The NIH recommends 8-12 repetitions of squats, rows, and leg lifts. “Strength training preserves independence better than any pill,” states a Harvard Medical School report.
Pair this with daily activity:
- 10-minute walks after meals
- Chair yoga sessions
- Gardening or household tasks
Track progress using a waist tape measure and activity journal. Women reducing waist circumference by 2 inches cut diabetes risk by 15%, per CDC data. Celebrate non-scale victories like easier stair climbing or tighter belt notches.
Conclusion
Aging well requires tools that reflect your body’s evolving needs. The weight chart for older women combines BMI ranges, waist measurements, and activity levels to create personalized health insights. Studies from the CDC confirm that adults maintaining a waist size under 35 inches reduce heart risks by 22%, even with higher body mass index values.
Regularly tracking these metrics helps spot trends before they become problems. For example, pairing monthly waist circumference checks with BMI calculations provides clearer guidance than either metric alone. Resources like specialized BMI charts simplify this process by integrating age-adjusted thresholds.
Focus on sustainable habits:
- Use resistance training to preserve muscle mass
- Prioritize protein-rich meals for metabolic health
- Consult healthcare providers to refine goals
Remember, health isn’t about rigid numbers—it’s about balancing body composition with joyful movement and nourishing foods. Start small, measure consistently, and let data guide your journey toward lasting vitality.


