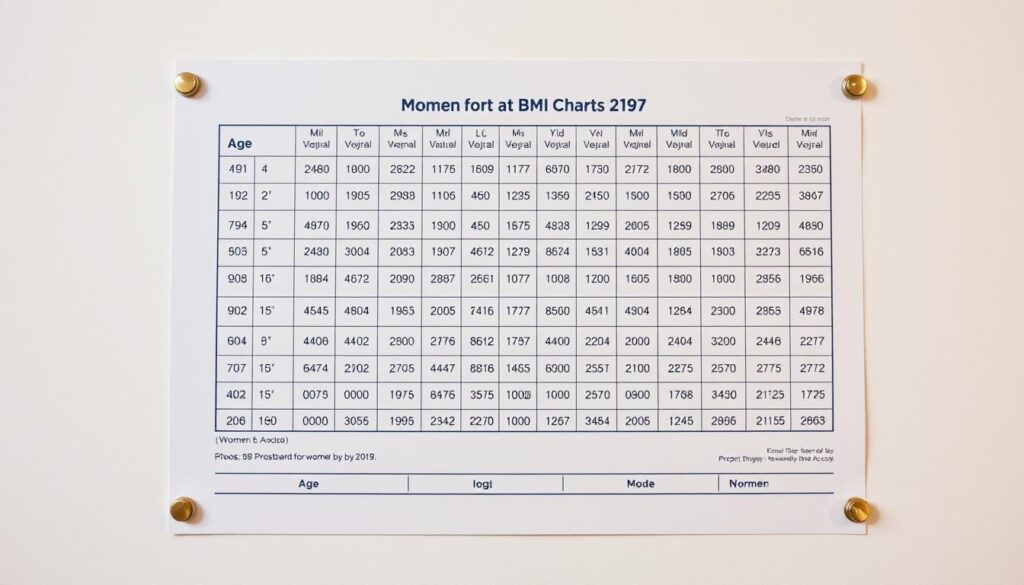
What if the tool you’ve been using to measure your health overlooks critical factors like age and body composition? The body mass index has long served as a standard screening method, endorsed by organizations like the CDC and Medical News Today. But when evaluating results from a bmi chart for women by age, questions arise about its ability to reflect true wellness.
This guide explores how to interpret these charts effectively while acknowledging their limitations. Unlike generic calculators, age-specific evaluations account for natural changes in muscle mass and metabolic patterns over time. Our focus centers on helping women understand where this tool fits within broader health assessments.
You’ll discover why accurate measurements matter more than raw numbers and how professionals use BMI alongside other diagnostics. Later sections will dive deeper into interpreting weight categories and optimizing body composition strategies.
Key Takeaways
- BMI charts categorize weight status but don’t measure body fat directly
- Age influences metabolic health and muscle-to-fat ratios in women
- Combining BMI with waist measurements improves accuracy
- Postmenopausal women often need adjusted interpretations
- Active individuals may register higher BMIs despite being healthy
- Medical professionals use BMI as a starting point for deeper analysis
Introduction to Women’s Health and BMI
Health assessments often miss key factors shaping wellness across life stages. Body Mass Index (BMI) offers a simple formula—weight divided by height squared—to categorize weight status. Medical News Today notes this tool helps identify potential risks but doesn’t measure body fat directly.
Overview of Body Mass Index
First developed in the 1830s, BMI remains popular due to its simplicity. Doctors use BMI alongside other tools like waist circumference for better accuracy. However, it may misclassify athletes or those with dense bones as overweight.
Why Age Matters in Health Evaluations
Metabolism slows by 3-5% per decade after 30, altering muscle-to-fat ratios. Postmenopausal women often gain abdominal fat, impacting overall health risks. These changes make age-specific charts valuable for maintaining a healthy weight.
| Metric | Measurement | Relevance |
|---|---|---|
| BMI | Weight/Height² | Initial risk screening |
| Waist Circumference | Inches around waist | Abdominal fat indicator |
| Hip Ratio | Waist ÷ Hip measurement | Cardiovascular risk assessment |
Studies show Black women often have higher muscle mass at lower BMI levels. This highlights why combining metrics like hip ratio provides clearer health status insights. Later sections will decode how to apply these findings to age-specific charts effectively.
Understanding BMI: Beyond the Numbers
A recent CDC report reveals 40% of adults classified as overweight via BMI actually have healthy metabolic profiles. This statistic exposes critical gaps in relying solely on height-weight ratios for health evaluations. While calculating BMI offers a quick screening method, it often overlooks vital biological factors.
Limitations of BMI Measurements
Standard formulas can’t distinguish between muscle and fat. Medical News Today notes athletes may show high scores despite low body fat. This leads to incorrect assumptions about weight-related health conditions.
| Measurement | What It Misses | Health Impact |
|---|---|---|
| BMI | Muscle vs. fat ratio | Misclassifies 1 in 5 active adults |
| Body Fat % | Fat distribution patterns | Identifies visceral fat risks |
| Waist Circumference | Bone density variations | Reveals metabolic syndrome clues |
Factors Like Muscle Mass and Body Composition
Bodybuilders and postmenopausal women often share similar BMI scores but face vastly different health conditions. Muscle weighs more than fat, skewing results. Researchers recommend pairing BMI with skinfold tests or DEXA scans for accurate body fat analysis.
“BMI alone can’t capture nuances like organ fat or hydration levels,” states a CDC advisory. “Combine it with waist measurements for actionable insights.”
Studies show people with “normal” BMI but high fat percentages face increased diabetes risks. This proves body composition matters more than raw numbers. Later sections will explore advanced tools to assess health beyond basic charts.
How to Use a bmi chart for women by age
Interpreting weight status categories requires precision and context. Start by measuring height without shoes using a wall-mounted stadiometer. Record weight first thing in the morning on a calibrated scale, wearing light clothing. Locate your age group on the chart’s vertical axis and match it with your calculated value.
Step-by-Step Guide to Read the Chart
Common errors include rounding measurements or using outdated tools. A 2-inch difference in height can shift results by 5-7 points. Always use exact numbers—don’t estimate. Check if your chart accounts for age-related muscle loss, which affects mass distribution.
Tips for Accurate Measurements
Morning measurements reduce food/water weight variances. Stand straight against the wall, heels together, for proper height assessment. Research shows 68% of people misreport weight by 3+ pounds. Digital scales on hard floors yield the most reliable data.
Athletes may fall into “overweight” ranges despite low body fat. Conversely, older adults with “normal” scores might carry excess visceral fat. Pair your results with waist circumference to better gauge obesity risk.
“Precision matters more than perfection. Track trends over weeks, not daily fluctuations.”
Factors Affecting BMI in Women
Genetic heritage and cultural backgrounds shape how bodies store fat and build muscle, making universal health metrics unreliable. These variations explain why two people with identical index scores might face different health risks.
Impact of Race, Ethnicity, and Genetics
Studies reveal Black females often maintain higher lean muscle mass at lower weight classifications. This trait can skew results when using standard assessment tools. Asian populations frequently show elevated diabetes risks at lower scores due to central fat storage patterns.
| Ethnic Group | Body Composition Trait | Health Implication |
|---|---|---|
| Black Women | Higher muscle density | Underestimated leanness |
| Asian Women | Visceral fat tendency | Increased metabolic risks |
| Caucasian Women | Even fat distribution | Standard BMI alignment |
Age-Related Health Changes
Metabolic shifts after 40 alter how bodies process energy. Hormonal changes during menopause often redistribute fat to the abdominal area, increasing waist measurements. Muscle loss accelerates by 1-2% annually post-50, affecting composition assessments.
“A 55-year-old and 25-year-old with the same score may have vastly different health profiles,” notes a Johns Hopkins study. “Age-adjusted evaluations prevent misdiagnosis.”
Active seniors might retain healthy muscle despite higher weight classifications. Conversely, sedentary individuals could show “normal” scores while carrying excess fat. Pairing index data with mobility tests provides clearer insights.
Practical Tips for Achieving a Healthy Weight
Sustainable weight management requires more than temporary fixes. Focus on gradual changes that align with your body’s needs and lifestyle. Pairing data from health charts with daily habits creates lasting results.
Diet and Exercise Strategies
Start with small swaps: replace sugary drinks with infused water or herbal tea. Studies show adding 30 minutes of brisk walking daily burns 150+ pounds annually. Measure portions using hand-size comparisons—your palm equals 3-4oz of protein.
Incorporate strength training twice weekly to maintain muscle ratio. The American College of Obstetricians and Gynecologists recommends 150 minutes of moderate activity weekly. Track progress through waist and hip measurements, not just scale numbers.
Consulting Health Professionals
Regular measurement check-ins help spot trends before they become health risks. Share your chart data with nutritionists to create personalized plans. Those with chronic disease risks might need tailored calorie targets.
“Aim for 1-2 pounds of weight loss weekly through balanced nutrition,” advises a 2023 Johns Hopkins study. “Crash diets often backfire by slowing metabolism.”
Combine chart insights with blood tests and body scans for full-body assessments. Professionals can adjust strategies based on muscle mass, bone density, and genetic factors that charts alone miss.
Additional Measurement Tools for Overall Health
Modern health evaluations require more than a single measurement to capture true wellness. While standardized tools offer quick insights, combining metrics paints a clearer picture of health status. Experts recommend using three complementary methods for balanced assessments.
Comparing BMI With Waist-to-Hip Ratio and WtHR
The waist-to-hip ratio (WHR) measures fat distribution by dividing waist circumference by hip size. Values above 0.85 in women signal higher heart disease risk, according to the National Institutes of Health. Waist-to-height ratio (WtHR) uses waist inches divided by height in inches—aim for under 0.5.
| Measurement | Focus Area | Limitations |
|---|---|---|
| WHR | Fat distribution patterns | Doesn’t account for muscle mass |
| WtHR | Central obesity risks | Less effective for tall individuals |
Understanding Body Fat Percentage
This tool directly measures fat versus lean tissue. Healthy ranges vary by age—women under 40 should aim for 21-33%, while those over 60 may have 24-36%. Calipers or bioelectrical scales provide affordable measure options, though DEXA scans offer hospital-grade accuracy.
“A 35-year-old runner with 18% body fat and ‘overweight’ BMI shows why single metrics fail,” explains Mayo Clinic research. “Multi-tool analysis prevents misjudgments.”
Active individuals and older adults often benefit most from this way of assessment. For example, postmenopausal women might have normal index scores but dangerous visceral fat levels. Pairing methods helps tailor fitness plans to actual health status.
Conclusion
Navigating health tools requires understanding their purpose and boundaries. The body mass index serves as a practical screening resource when paired with age-specific insights. However, its limitations—like overlooking muscle density or fat distribution patterns—demand complementary assessments.
Key takeaways highlight the value of context. For example, women of different race backgrounds may share identical scores but face distinct risks due to genetic body composition traits. Professionals often combine waist measurements or body fat analysis for clearer health snapshots.
Age-related metabolic shifts and muscle loss further emphasize why single metrics fall short. Referencing health guidelines, central obesity risks increase when waistlines exceed 35 inches—a critical detail charts alone miss.
Use the step-by-step guides provided as launchpads for personal wellness journeys. Consult healthcare providers to interpret results through lenses like race or activity levels. For example, active seniors might need adjusted benchmarks compared to sedentary peers.
Embrace a multidimensional approach: track trends, measure progress beyond weight, and prioritize sustainable habits. Proactive health management starts with recognizing no single tool tells the full story—but together, they create actionable roadmaps.


