Have you ever wondered how professionals quickly assess whether someone’s weight aligns with their height? Our tool simplifies this process, delivering instant clarity about your wellness. Whether you prefer pounds or kilograms, inches or centimeters, this resource adapts to your needs effortlessly.
Designed for accuracy, our platform calculates your mass index using globally recognized formulas. Enter your details once, and you’ll receive a precise number like “23 kg/m² (Normal)” alongside personalized healthy weight ranges. These insights help identify if you’re underweight, within the ideal range, or carrying excess body mass that could impact longevity.
We prioritize transparency. Results categorize your status using standards from leading health organizations, removing guesswork. For those seeking deeper analysis, metrics like BMI Prime add extra layers of understanding. Curious how this applies specifically to males? Explore our essential tool for adult male health.
Key Takeaways
- Instant results categorize your status as underweight, normal, overweight, or obese
- Accepts both metric and US customary measurements for universal accessibility
- Displays personalized healthy weight ranges based on height and age
- Incorporates BMI Prime for advanced health insights
- Adheres to international standards for reliable classification
Understanding BMI and Its Importance
Body Mass Index serves as a universal gauge for health assessments worldwide. This numerical value compares body weight to height, offering insights into potential health risks. Leading organizations like the World Health Organization and Centers for Disease Control use it to identify trends in populations.
What Is Body Mass Index?
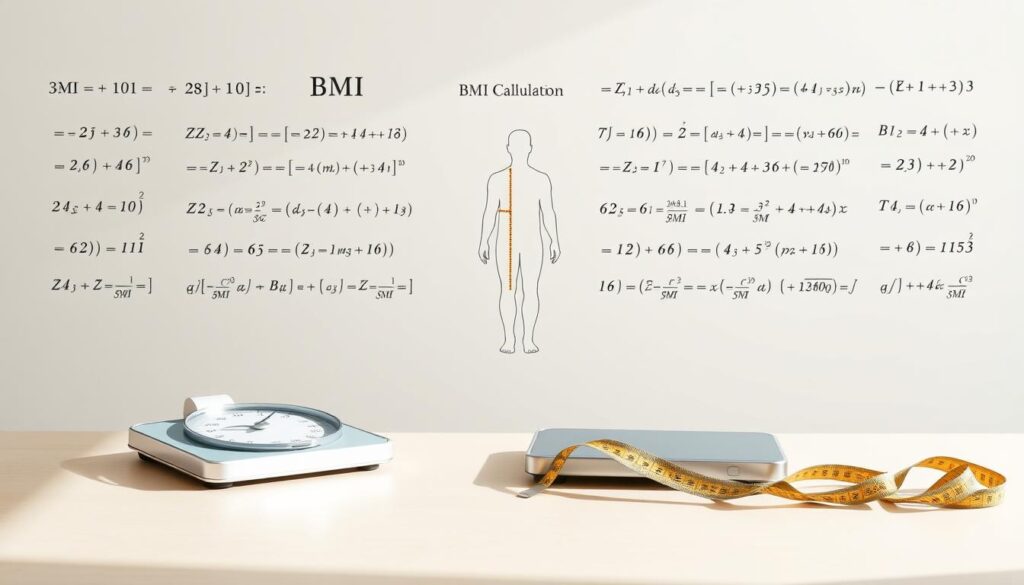
The body mass index calculates mass relative to height using a simple formula: weight (kg) divided by height squared (m²). While it doesn’t directly measure body fat, studies show it correlates strongly with clinical assessments.
“BMI remains a practical screening tool for identifying weight categories,”
states the CDC’s guidance on pediatric evaluations.
BMI Categories for Adults and Children
Adult classifications follow WHO standards, while children use growth charts with percentiles. Below is a comparison:
| Category | Adults (WHO) | Children (CDC) |
|---|---|---|
| Underweight | < 18.5 | < 5th percentile |
| Healthy | 18.5 – 24.9 | 5th – 85th percentile |
| Overweight | 25 – 29.9 | 85th – 95th percentile |
| Obese | ≥ 30 | ≥ 95th percentile |
Teens require specialized charts due to growth spurts. A 12-year-old at the 90th percentile, for example, needs different analysis than a 35-year-old with the same BMI. Always pair these numbers with waist measurements or blood tests for fuller health pictures.
How the BMI calculator for men and women Works
Health professionals rely on precise measurement systems to evaluate wellness. Our platform simplifies this through adaptable unit conversions and clear result interpretation.
Metric vs. US Customary Units
Choose between two formulas based on your preferred measurements:
- Metric method: Divide kilograms by height in meters squared (kg/m²)
- US method: Multiply pounds by 703, then divide by inches squared
A 160-pound individual at 5’10” (70 inches) calculates as: (703 × 160) ÷ 4,900 = 23.0. This matches the metric equivalent for 72.6 kg and 1.78 meters.
Step-by-Step Calculation Process
- Enter body weight using your scale’s units
- Input height accurately – convert feet/inches to inches or centimeters
- Select your measurement system preference
Double-check entries to avoid errors. Misreporting by just 2 inches alters results by 5% – enough to shift categories.
Interpreting the Results Accurately
After calculation, you’ll see:
- Your mass index number
- Color-coded health category
- Personalized healthy weight range
These outputs reference WHO standards, helping adults understand where they fall. While useful, remember this body mass indicator works best alongside other health metrics.
Health Implications and Associated Risks
Maintaining a balanced body composition significantly impacts overall wellness. When weight-to-height ratios fall outside healthy ranges, both physical and metabolic functions face challenges. Let’s explore how extremes affect long-term health outcomes.
Risks of Excess Body Weight
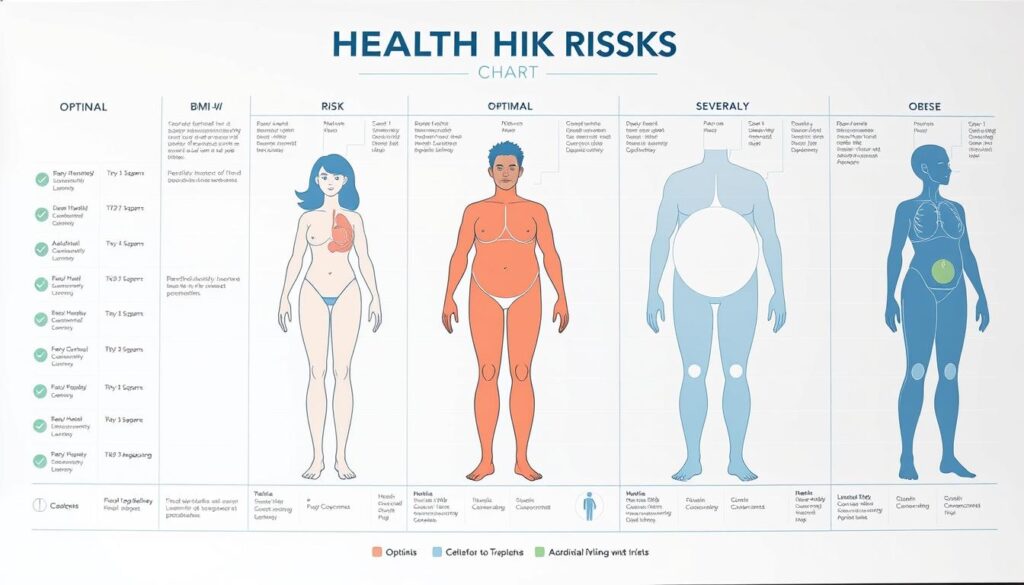
Higher body mass often correlates with increased fat storage, straining vital organs. The CDC reports that adults above the normal range face:
- 42% higher risk of type 2 diabetes
- 35% greater likelihood of heart disease
- 15% elevated cancer risk (per American Cancer Society)
Excess body weight contributes to chronic inflammation, accelerating conditions like hypertension. Studies show even a 5% reduction lowers these threats substantially.
Consequences of Low Body Mass
Insufficient weight weakens the body’s defenses. Common issues include:
| Risk Category | Children/Teens | Adults |
|---|---|---|
| Nutritional Deficits | Stunted growth | Osteoporosis |
| Immune Response | Frequent infections | Slow healing |
| Developmental Impact | Cognitive delays | Muscle loss |
For those outside ideal ranges, our strategies for improvement offer science-backed guidance. Always consult healthcare providers before making drastic changes – especially for children or individuals with existing conditions.
Limitations, BMI Prime, and Ponderal Index
While body mass calculations provide valuable insights, they don’t tell the whole story. Two key factors often overlooked are muscle distribution and bone density. A powerlifter and a sedentary office worker might share the same mass index despite vastly different health profiles.
Understanding BMI Limitations
The standard formula treats all weight equally – whether from muscle or fat. This means:
- Athletes may register as “overweight” due to dense muscle
- Older adults might show normal ranges despite losing muscle
Fat distribution also matters. Research shows abdominal fat poses greater risks than hip or thigh fat, yet traditional calculations ignore this.
Additional Measurements for Better Assessment
BMI Prime refines the classic model by comparing your result to the 25 kg/m² threshold. The formula: BMI ÷ 25. Scores above 1.0 indicate excess body mass relative to height.
“BMI Prime helps quantify how far someone exceeds the upper healthy limit,”
The Ponderal Index addresses height biases. By cubing height instead of squaring it, this metric better accommodates extremely tall or short individuals. Formula: weight (kg) ÷ height (m)³.
| Metric | Formula | Best For |
|---|---|---|
| Standard | Weight/Height² | General population |
| Prime | BMI ÷ 25 | Risk assessment |
| Ponderal | Weight/Height³ | Extreme heights |
For complete analysis, pair these tools with:
- Waist-to-hip ratio
- Body fat percentage tests
- Muscle mass scans
Conclusion
Understanding your body composition is key to long-term wellness. Our tool simplifies health assessments by measuring body mass index – a trusted metric used by organizations like the Disease Control and Prevention agencies. Whether tracking muscle mass changes or identifying potential health risks, this resource adapts to your needs with dual measurement systems and instant analysis.
Regular checks help maintain healthy weight ranges while revealing patterns over time. While not perfect, your mass index serves as a practical starting point when paired with waist measurements or body fat tests. Those outside normal ranges gain actionable insights to address concerns early, whether managing weight loss goals or nutritional needs.
We’ve designed this platform using guidelines from leading institutions to ensure reliability. Track progress monthly, share results with healthcare providers, and make informed decisions. Your fitness journey deserves tools that grow with you – start exploring today.


