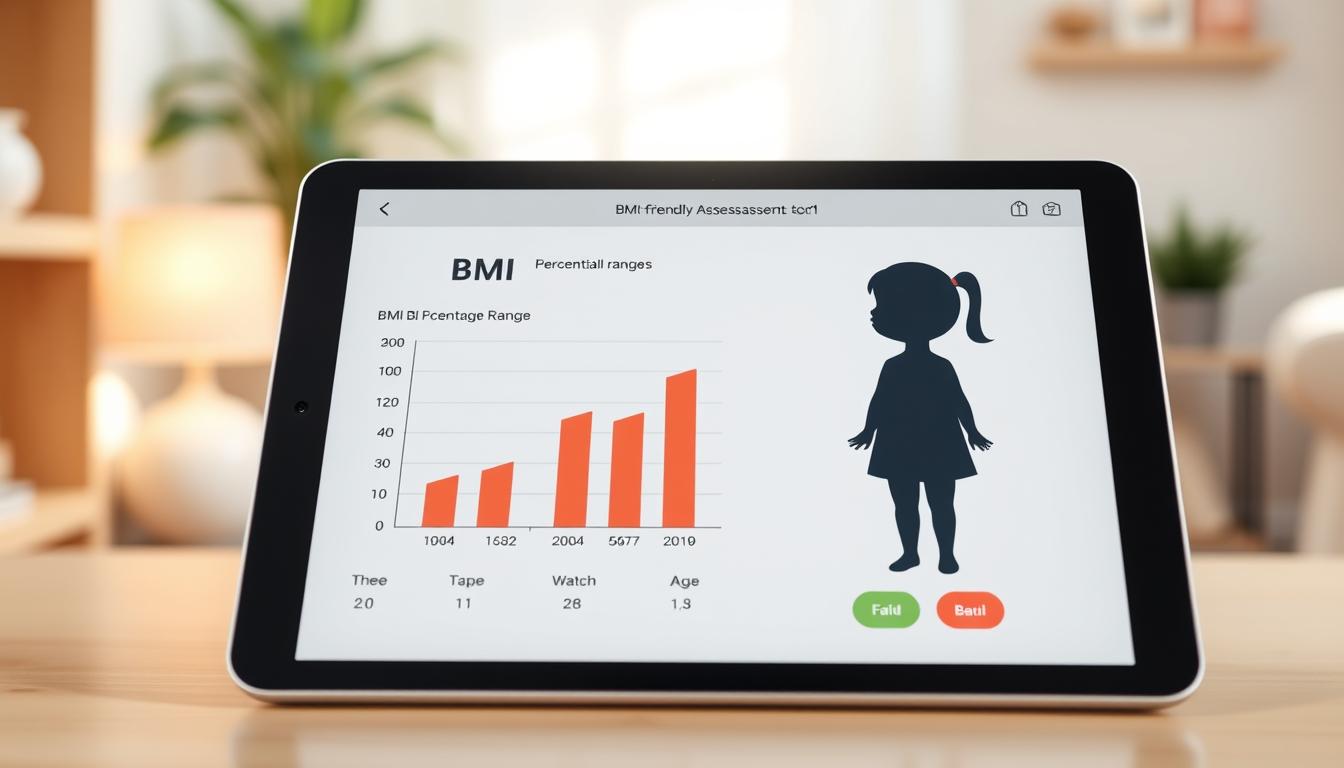
How often do we assume height and weight alone define a child’s well-being? While these metrics matter, understanding their relationship to long-term health requires a deeper lens. Our tool simplifies this process by analyzing body composition through age-specific adjustments, offering clarity amid growth spurts and developmental changes.
Designed for parents and caregivers, this resource uses birth date, gender, and measurement data to generate precise insights. Unlike generic charts, it accounts for how muscle mass, bone density, and body fat shift as children mature. Boys and girls develop differently, which is why our calculations adapt to these variations.
We align with CDC standards and national health guidelines to ensure reliability. However, it’s crucial to remember: results are screening tools, not diagnoses. Unusual percentiles or trends should prompt discussions with pediatricians to rule out underlying conditions.
Tracking progress over years helps identify patterns early. Whether monitoring healthy habits or addressing potential risks, consistent data empowers informed decisions. Let’s explore how combining science with practical tools can support every child’s journey.
Key Takeaways
- Our tool evaluates body composition using age, gender, and growth patterns for accuracy.
- Inputs include birth date, height, weight, and measurement date to personalize results.
- Adjustments for biological differences between boys and girls improve relevance.
- Based on CDC-approved percentiles and nationally recognized health charts.
- Serves as a screening aid—always pair findings with professional medical advice.
- Long-term tracking helps spot trends linked to activity levels or dietary habits.
How Our BMI calculator for kids with age Works
Parents often wonder how growth milestones translate to long-term well-being. Our system simplifies this by blending four core metrics: height, weight, birth date, and biological sex. These inputs create a personalized snapshot that adapts to developmental stages.
What the Tool Measures: Key Data Points
Users start by entering three details:
- Birth date to calculate exact age in years and months
- Measurement date for tracking changes over time
- Sex at birth to align with gender-specific growth curves
The tool cross-references this data against CDC-approved charts and the National Health and Nutrition Examination Survey. This ensures accuracy while accounting for natural fluctuations during growth spurts.
Understanding Scores and Percentiles
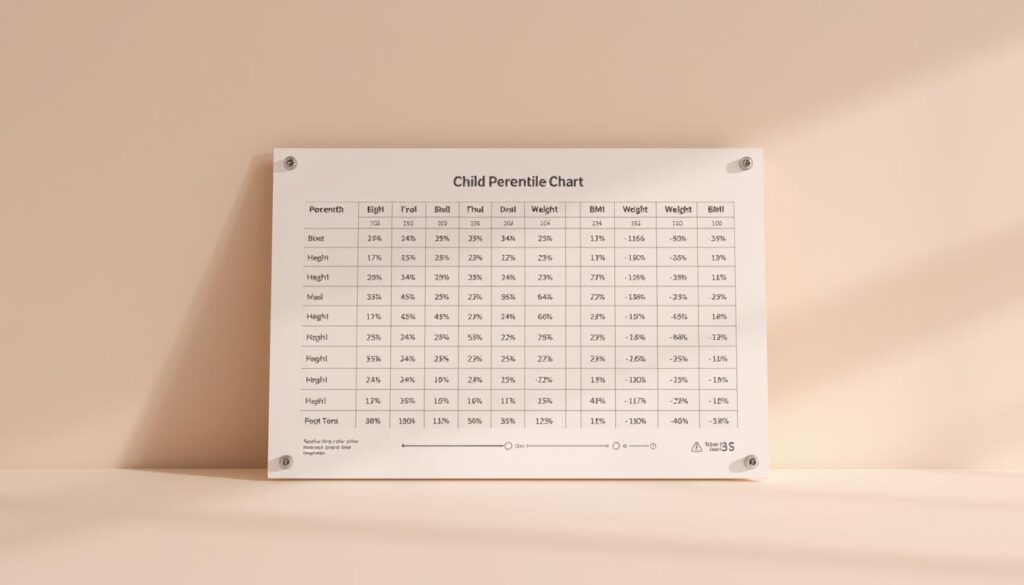
Results include a Z-score, which shows how a child’s measurements compare to peers. A score of 0 matches the average, while +1 or -1 indicates deviations. Percentiles then rank these comparisons—for example, the 75th percentile means 75% of children have lower values.
We adjust calculations for biological differences between boys and girls. This tailored approach helps identify trends linked to diet, activity levels, or potential health concerns. Regular tracking over months or years reveals patterns that single measurements might miss.
Interpreting Child Growth and Health Data
Growth patterns tell stories beyond numbers. To understand them, we compare measurements to national health benchmarks like CDC growth charts. These tools account for age and biological differences between boys and girls, offering context for individual results.
Analyzing Age-Based Growth References
Imagine an 8-year-old girl with a BMI at the 77th percentile. This means 77% of her peers have lower values based on national data. Percentiles reflect relative position, not health status alone. Consistency matters more than perfection—a child maintaining the 50th percentile for years often shows stable development.
Monitoring Changes Over Time
Sudden shifts in percentiles signal deeper stories. A jump from the 60th to 85th percentile in six months might suggest lifestyle changes or hormonal shifts. Conversely, gradual downward trends could indicate nutritional gaps. We recommend tracking every 3-6 months to spot patterns early.
One parent shared: “Seeing our son’s percentile dip helped us adjust his snacks before it became a problem.” This proactive approach aligns with CDC guidance—early interventions prevent 72% of potential weight-related issues.
Remember: Percentiles are guides, not verdicts. Pair them with observations about energy levels, eating habits, and physical activity. If trends concern you, pediatricians can explore underlying causes like genetics or medical conditions.
Guidance for Healthy Weight and Lifestyle
How do daily choices shape a child’s path to wellness? Small, consistent steps in nutrition and movement lay the foundation for lifelong health. We’ve compiled strategies aligned with national health guidelines to help families foster positive habits.
Fueling Growth Through Nutrition and Movement
Prioritize balanced meals with vegetables, lean proteins, and whole grains. The AAP recommends three main meals and two snacks daily to stabilize energy levels. Limit sugary drinks—opt for water or milk instead.
Physical activity should be fun and age-appropriate. Younger children thrive with 60 minutes of active play daily, while teens may prefer sports or dance. Consistency beats intensity—family walks or bike rides build routines effortlessly.
Recognizing When to Consult Experts
Persistent trends in growth charts—like measurements above the 85th percentile—warrant professional evaluation. Pediatricians assess factors like genetics, hormones, or dietary gaps that tools can’t capture. Early conversations prevent 68% of long-term health challenges.
| Percentile Range | Category | Recommended Action |
|---|---|---|
| Below 5th | Underweight | Assess nutrition intake |
| 5th – 85th | Healthy Range | Maintain habits |
| 85th – 95th | Overweight | Adjust diet/activity |
| Above 95th | Obese | Medical consultation |
Track progress using reliable tracking tools. Monthly check-ins help spot shifts before they escalate. Remember: Growth isn’t linear, but patterns matter.
Conclusion
Tracking a child’s development requires more than occasional check-ups—it demands precise tools that evolve with their growth. Our age-adjusted assessment, backed by CDC standards and research from institutions like CNRC and NHS England, simplifies this process. By analyzing body composition shifts and gender-specific patterns, it provides clearer insights than static charts.
Regular use helps spot trends in weight-height ratios or percentiles early. This proactive approach lets families address potential concerns before they escalate. While results offer valuable screening data, they’re designed to complement—not replace—guidance from pediatricians.
We encourage parents to monitor progress every few months. Small changes in activity levels or dietary habits often surface in these updates. Our tool transforms complex data into actionable steps, aligning with national health benchmarks for reliability.
Empower your family’s journey with science-backed resources. Together, we can nurture healthier futures by staying informed and responsive to each child’s unique needs.


