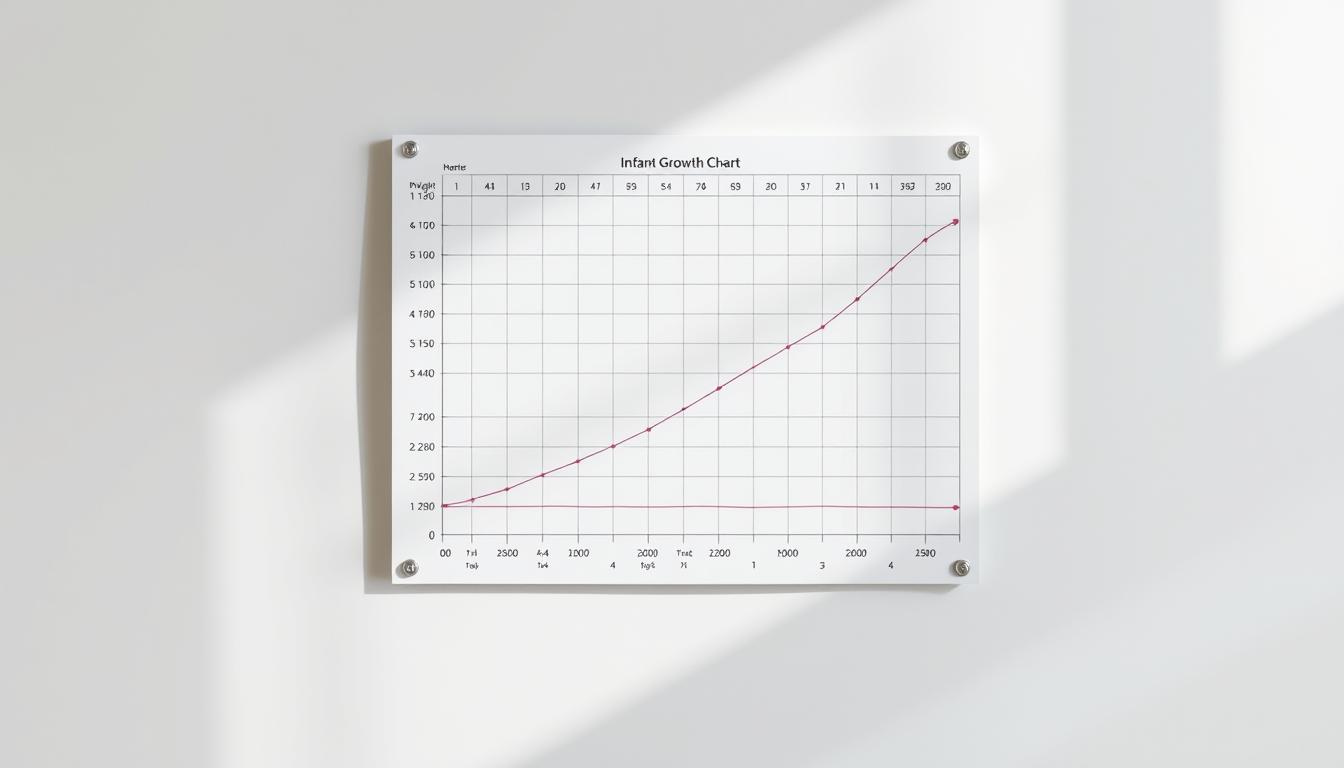
What if the way we measure a child’s development doesn’t account for unique factors in bustling urban environments? Parents and caregivers often rely on generic tools to track progress, but location, lifestyle, and local health trends can shape growth patterns. Our team designed a resource to address this gap.
Tracking a young one’s well-being requires precision. We’ve developed an easy-to-use tool tailored for infants, using trusted data adjusted for age, gender, and regional considerations. By inputting simple metrics like weight and height, families gain clarity on how their child compares to national percentiles.
Why does this matter? Early identification of trends helps caregivers make informed choices. Unlike basic calculators, our system references up-to-date guidelines from healthweightcalculator.com, ensuring reliability. This article will explore how body composition, growth charts, and percentile data work together to paint a clearer picture of health.
Key Takeaways
- Our tool simplifies tracking development with location-specific insights.
- Age and gender adjustments ensure personalized results.
- Accurate weight and height inputs improve result reliability.
- Percentile comparisons help identify growth trends early.
- Trusted data sources back every calculation.
Understanding BMI and Its Importance for Infant Health
Tracking a child’s progress involves more than just numbers—it’s about context. Body Mass Index (BMI) measures weight relative to height, offering insights into growth patterns. At healthweightcalculator.com, we align our methods with CDC standards to ensure accuracy.
Breaking Down the Formula
BMI is calculated by dividing weight (in kilograms) by height (in meters squared). For infants, adjustments are made for age and gender, as growth rates vary. This metric helps identify trends early, though it doesn’t measure body fat directly.
Why Percentiles Matter
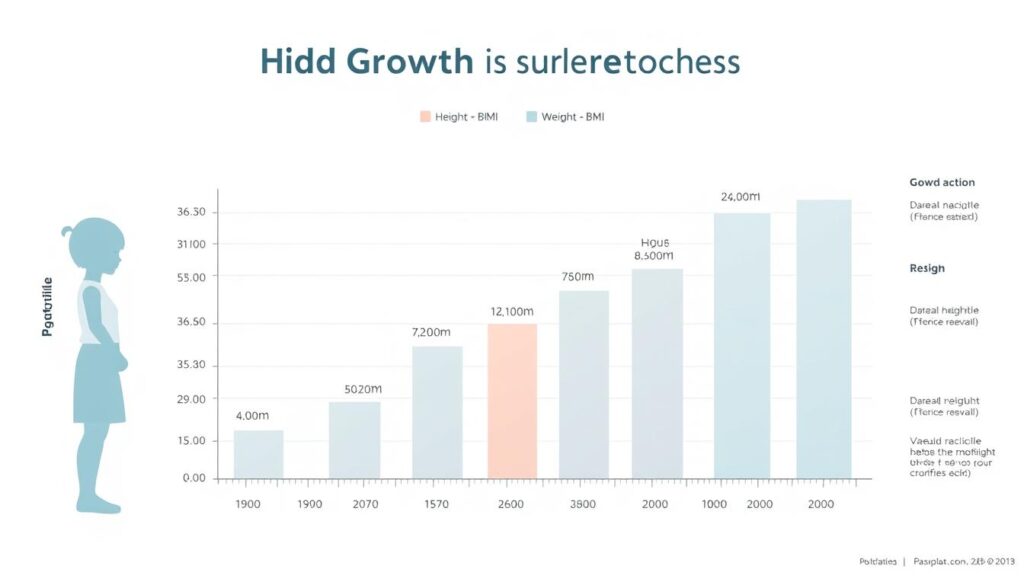
Growth charts use percentiles to compare a child’s measurements to peers. For example:
| Category | Percentile Range | Action Step |
|---|---|---|
| Underweight | Below 5th | Consult pediatrician |
| Healthy | 5th–85th | Monitor regularly |
| Overweight | 85th–95th | Discuss nutrition |
The American Academy of Pediatrics emphasizes that percentiles show growth trends over time, not single measurements. Our tool simplifies this analysis, using trusted data to guide caregivers.
While BMI isn’t a diagnosis, it’s a practical starting point. Combined with professional advice, it helps families make informed choices about nutrition and activity levels.
Using BMI calculator for infants in New York Effectively
Accurate data forms the foundation of reliable growth tracking. Our tool simplifies this process while accounting for factors like activity levels and local nutrition trends. Start by gathering precise measurements using these best practices.
Inputting Accurate Measurements
Use a calibrated digital scale for weight checks, ideally when the child is lightly clothed. For height, measure lying flat with legs fully extended. Even a half-inch difference can shift percentile rankings significantly.
- Record measurements within 24 hours of check-ups
- Update the age field monthly for infants under 12 months
- Double-check units (pounds vs. kilograms)
Tailoring Calculations to Individual Needs
Boys and girls follow distinct growth curves. Our system applies gender-specific adjustments while comparing results to CDC standards. See how this works:
| Gender | Average Weight Gain | Key Percentile Shift |
|---|---|---|
| Female | 5-7 oz/week | 8th–12th month |
| Male | 6-8 oz/week | 6th–9th month |
Regular updates help identify patterns. As healthweightcalculator.com notes, “Consistent tracking reveals meaningful trends better than single data points.” We automate percentile comparisons, giving caregivers actionable insights without complex math.
Interpreting Results and Promoting a Healthy Weight
Understanding your child’s growth data is like decoding a personalized health story. Our tool transforms numbers into actionable insights using growth charts from healthweightcalculator.com. Let’s explore how to read these results and use them effectively.
Decoding BMI Percentiles and What They Mean
Percentiles compare your child’s measurements to others of the same age and gender. For example, a 70th percentile means 70% of peers weigh less. Here’s how to interpret ranges:
| Percentile Range | Health Indicator | Recommended Action |
|---|---|---|
| Below 5th | Potential underweight | Consult healthcare provider |
| 5th–84th | Typical growth pattern | Continue regular tracking |
| 85th–94th | Higher-than-average weight | Review nutrition habits |
Small shifts over time matter more than single readings. A drop from the 60th to 40th percentile could signal slower growth, even if both numbers fall within “typical” ranges.
Leveraging Data for Informed Decisions
Our system uses z-scores – statistical measures showing how far a result deviates from average. Combined with growth charts, this helps identify trends early. Consider these scenarios:
- A 9-month-old boy consistently at the 90th percentile may need adjusted feeding routines
- A 6-month-old girl fluctuating between 30th–40th percentiles likely follows a healthy curve
Always discuss concerning patterns with your pediatrician. As healthweightcalculator.com emphasizes, “Percentiles guide – they don’t diagnose.” Pair this data with observations of energy levels and developmental milestones for a complete picture.
Conclusion
Tracking a child’s growth requires both precision and context. Our tool simplifies this process by blending weight-height ratios with age-specific adjustments, offering clear insights into development patterns. Regular check-ins using trusted percentiles help spot trends early, whether a child falls within typical ranges or needs extra attention.
Accurate measurements matter. Small errors in recording weight or height can shift percentile rankings. We’ve designed our system to minimize guesswork, using guidelines from healthweightcalculator.com to ensure reliability. This approach helps families make informed choices about nutrition and activity levels.
Remember:
- Growth charts reflect trends, not single moments
- Gender-specific curves guide personalized tracking
- Consistent updates reveal meaningful patterns
While our resource provides valuable data, always consult a healthcare provider for concerns. Visit healthweightcalculator.com for deeper analysis and ongoing support. Together, we can nurture healthier futures—one measurement at a time.


