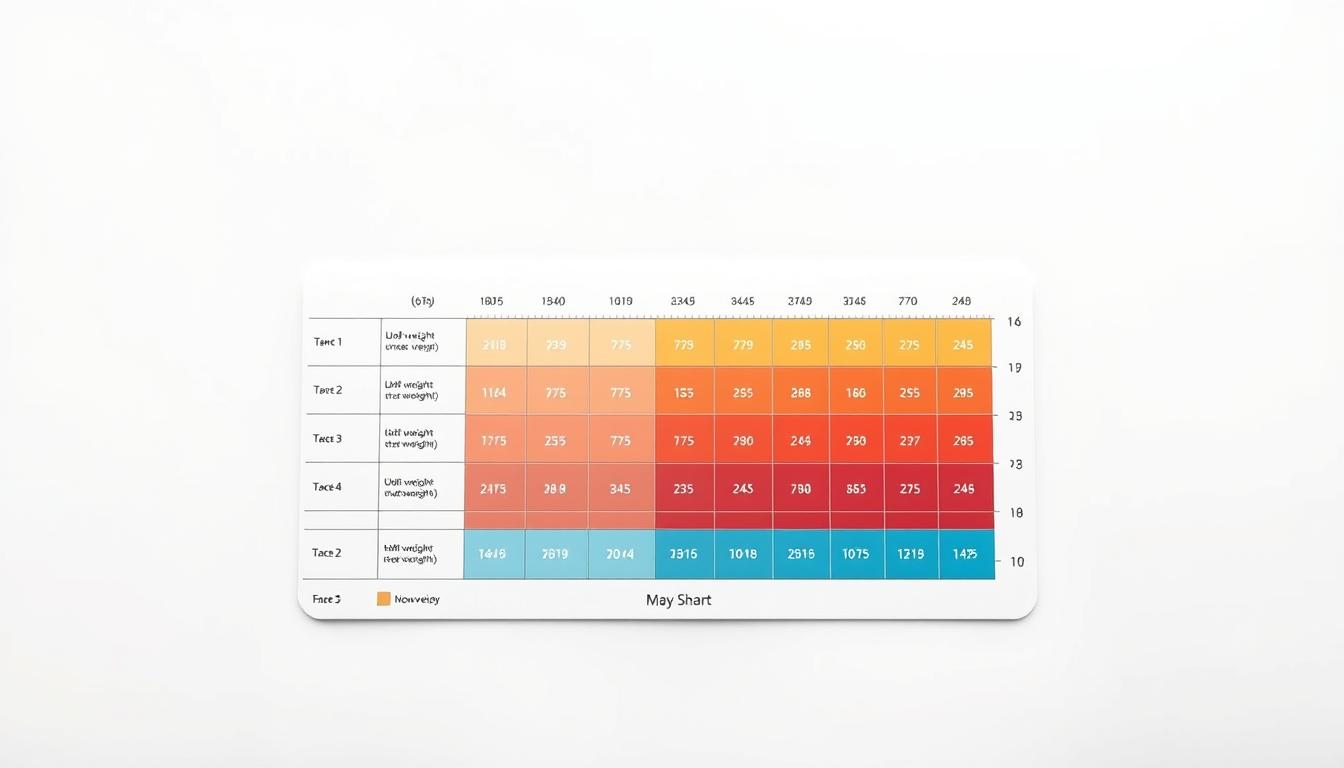
Imagine having a quick way to assess whether your weight aligns with what’s considered healthy for your age and height. A BMI calculator by age, height, and weight does exactly that. It uses a simple formula to evaluate body composition, helping millions in the United States understand their health status.
This tool calculates Body Mass Index (BMI) by dividing kilograms by meters squared or adjusting for pounds and inches. While not a diagnostic measure, it offers a starting point for conversations about wellness. The ranges—underweight, normal, overweight, and obese—apply to individuals aged 2 to 120, making it versatile for families.
Why does this matter? Studies show that maintaining a healthy BMI reduces risks for chronic conditions. Our calculator supports both metric and imperial units, ensuring accessibility. For those seeking deeper insights, we’ve included charts and effective body composition strategies to pair with your results.
Key Takeaways
- BMI evaluates weight relative to height and age using standardized categories.
- The tool works for all ages (2–120) and adapts to imperial/metric measurements.
- Results provide a general health snapshot, not medical advice.
- Higher BMI correlates with increased risk for certain diseases.
- Combining BMI data with body fat analysis offers clearer health insights.
Understanding Body Mass Index (BMI) and Its Impact on Health
Body Mass Index (BMI) provides a numerical value that helps gauge health risks linked to body composition. Recognized globally, this metric evaluates whether an individual’s weight aligns with their height, offering a standardized approach to identify potential concerns. While not a diagnostic tool, it remains widely used in clinical and public health settings.
What Is BMI and How Is It Calculated?
The formula divides weight in kilograms by height in meters squared. For imperial measurements, multiply weight in pounds by 703, then divide by height in inches squared. For example, a person weighing 160 pounds at 5’7” (67 inches) would calculate: (160 x 703) ÷ (67²) = 25.1.
BMI Categories and Associated Health Risks
The CDC defines four ranges:
- Underweight (
- Normal (18.5–24.9): Lowest risk for weight-related conditions.
- Overweight (25–29.9): Higher likelihood of hypertension or prediabetes.
- Obese (≥30): Elevated chances of heart disease and Type II diabetes.
Children use percentiles based on growth charts. A 95th percentile or higher indicates obesity. However, BMI doesn’t distinguish muscle from fat or assess fat distribution. Pairing it with waist measurements or body fat analysis improves accuracy.
“BMI is a useful screening tool, but it should not replace comprehensive health evaluations.”
Using the bmi calculator by age height and weight
Accurate health insights begin with precise data entry. This tool requires three critical details: age, height, and body weight. Each plays a distinct role in determining outcomes, especially for growing children and teens.
Input Parameters: Age, Height, and Weight
Start by selecting your measurement system—imperial (feet/inches, pounds) or metric (cm/kg). Enter your current age in years, as growth patterns differ between younger and older individuals. For height, measure without shoes, rounding to the nearest half-inch or centimeter. Record weight in the morning for consistency.
The system instantly processes these values using standardized formulas. For minors, results compare against growth charts to determine percentile rankings. Adults receive numerical scores categorized into four health ranges.
Interpreting Your BMI Results
After calculation, you’ll see:
- A numerical value indicating your weight-to-height ratio
- Color-coded status (underweight, healthy, etc.)
- Growth curve visuals for users under 20
Children’s outcomes reflect developmental norms, while adult categories remain fixed. A score above the 95th percentile for minors suggests obesity risks. Always discuss unusual readings with healthcare providers.
“Regular BMI checks help track developmental progress and identify trends early.”
Advantages, Limitations, and Key Health Factors
Evaluating body composition involves more than just numbers on a scale. While standardized tools offer quick insights, they must be paired with context to paint a full picture of wellness.
Why This Tool Matters
The primary strength of mass evaluation methods lies in their simplicity. Users gain immediate feedback on weight status, which can motivate proactive lifestyle changes. For teens and women, tracking trends over time helps identify hormonal or metabolic shifts.
Gaps in the Data
However, these metrics don’t distinguish between muscle and fat. Athletes or physically active individuals often receive misleading scores due to higher lean mass. Similarly, older adults may show “normal” results despite losing muscle tone—a condition called sarcopenia.
“No single measure defines health. Combine screenings with blood tests and physical assessments for accuracy.”
| Metric | Purpose | Best For |
|---|---|---|
| BMI | Weight-to-height ratio | General population screening |
| Waist-to-Height Ratio | Abdominal fat analysis | Assessing heart disease risk |
| Body Fat Percentage | Muscle/fat differentiation | Athletes, fitness enthusiasts |
Key factors like activity level and genetic predispositions influence results. For example, those with dense muscle may prefer the Ponderal Index, which adjusts for height cubed. Always consult a professional when interpreting health risks associated with excess body.
Conclusion
Understanding your body’s needs starts with accessible tools that simplify health awareness. The body mass index offers a practical snapshot of how measurements align with wellness benchmarks. By entering basic details like years lived and physical dimensions, individuals gain insights into potential risks tied to excess fat or muscle imbalances.
While this method highlights trends, it’s crucial to recognize its boundaries. Scores don’t differentiate between lean tissue and stored energy, which can skew results for athletes or older adults. Pairing these numbers with waist measurements or activity logs creates a fuller picture of well-being.
Use the tool’s outputs as a springboard for deeper conversations. Track changes over time, especially for growing children, and compare them to standardized charts. Remember: no single metric defines health. Combine screenings with blood tests, fitness assessments, and professional guidance to craft a strategy tailored to your unique needs.
Prioritize habits that support sustainable vitality—balanced nutrition, regular movement, and stress management. Knowledge empowers action, and small steps today can shape healthier tomorrows.


