What if a single number could reveal your health risks—but you’ve been interpreting it wrong all along? While many associate body mass with appearance, it’s actually a critical window into your overall wellness. Our interactive tool cuts through the noise to give you clarity.
We designed this service to deliver instant insights using height and weight data. Whether you prefer pounds or kilograms, the system adapts to your needs. Results categorize your status—like underweight or obese—while explaining how body fat percentages relate to these ranges.
Transparency drives every feature. For example, a score of 23 kg/m² falls within the widely recognized healthy zone (18.5–25 kg/m²). These benchmarks, backed by medical research, help assess risks for heart disease and other conditions. But numbers alone don’t tell the full story—that’s why we pair them with actionable context.
Key Takeaways
- Instant analysis of weight status using metric or USC measurements
- Clear categorization into underweight, normal, overweight, or obese ranges
- Evidence-based health risk assessments linked to body composition
- Reliable reference data, including the 18.5–25 kg/m² healthy zone
- User-friendly design prioritizing speed and accuracy
Understanding BMI and Its Significance
Health metrics often simplify complex biological factors into actionable insights. Body Mass Index (BMI) measures weight relative to height squared, creating a ratio that helps categorize potential health risks. Unlike direct body fat analysis, this mass-to-height ratio doesn’t distinguish between muscle and adipose tissue—a critical distinction for athletes or older individuals.
Defining Body Mass Index and Body Fat
Body fat refers specifically to adipose tissue, while lean mass includes muscles, bones, and organs. A person with high muscle density might share the same BMI as someone with elevated fat levels, despite having vastly different health profiles. For example, the CDC classifies scores below 18.5 as underweight and those above 30 as obese.
“BMI provides a population-level snapshot but shouldn’t replace individualized assessments,” notes a WHO report on metabolic risks.
How BMI is Calculated and Its Limitations
The formula divides weight (in kilograms) by height (in meters squared). For imperial units, multiply pounds by 703 and divide by inches squared. This approach works for most people but struggles with:
- Muscle-heavy physiques (athletes, laborers)
- Age-related muscle loss
- Ethnic variations in body composition
| Index | Formula | Use Case |
|---|---|---|
| BMI | Weight/Height² | General screening |
| BMI Prime | BMI/25 | Comparing to upper limit |
| Ponderal | Weight/Height³ | Children’s growth |
While BMI correlates with heart disease and diabetes risks, factors like activity level and genetics refine its meaning. We combine this data with lifestyle context to give you balanced insights.
BMI Calculator for Adults: How Our Tool Works
Understanding your body’s numbers starts with precise measurement tools. Our system simplifies the process while maintaining clinical accuracy, whether you’re tracking progress or evaluating potential health risks.
Using Metric and USC Units for Calculation
Choose centimeters/kilograms or feet-pounds—the tool adapts instantly. For example, a 5’10” person weighing 160 pounds gets calculated as (703 × 160) ÷ (70²) = 23. This matches the healthy weight range (18.5–25 kg/m²) recognized by the CDC and WHO.
Interpreting Results and Categories
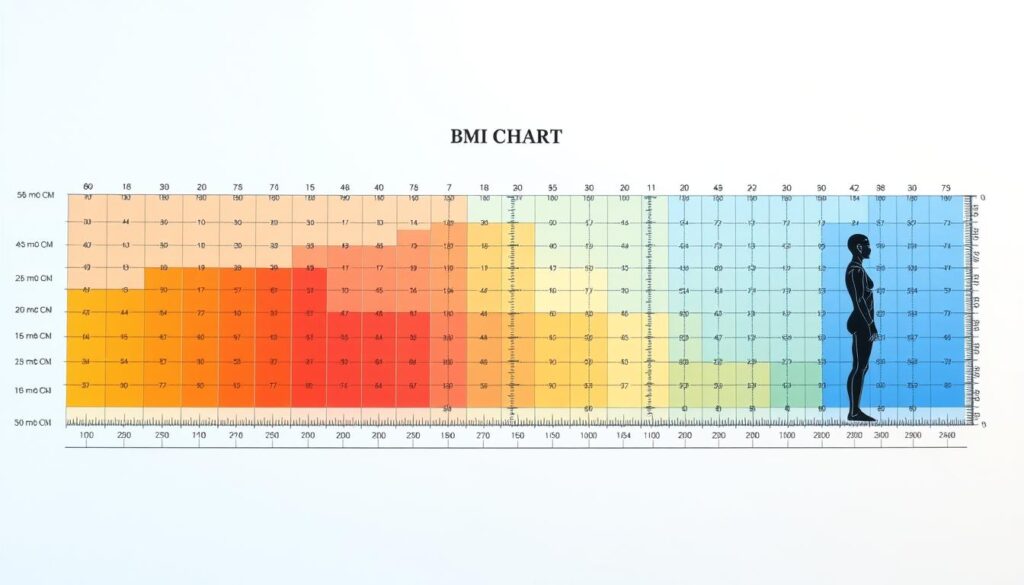
After you calculate BMI, the system classifies results into four groups:
- Underweight (
- Healthy weight (18.5–24.9)
- Overweight (25–29.9)
- Obesity (30+)
These categories correlate with risk levels for type 2 diabetes, heart issues, and certain cancers. While designed for adults, the underlying science helps compare different people’s health profiles, including children in specialized assessments.
Want clarity? Use our interactive resource to assess your status in seconds. It’s more than numbers—it’s actionable insight for maintaining a healthy weight.
Health Implications and Risks Associated with BMI
Numbers shape health stories, but their true meaning often hides in context. Body composition analysis reveals how weight distribution affects organ function and disease susceptibility. Our categories help identify patterns linked to chronic conditions, though individual factors like muscle mass and age demand equal attention.
Risks of Being Overweight and Underweight
Excess weight strains the cardiovascular system, increasing LDL cholesterol and blood pressure. The CDC reports 74% of adults with obesity face higher type 2 diabetes risks. Conversely, low body mass often signals nutrient deficiencies—12% of underweight individuals develop osteoporosis before age 50.
Impact on Heart Disease, Diabetes, and Certain Cancers
Research shows a clear range-based correlation:
| Condition | Overweight Risk | Underweight Risk |
|---|---|---|
| Heart Disease | +40% | +15% |
| Breast Cancer | +20% | No significant link |
| Diabetes | +80% | +25% |
These numbers highlight why medical professionals use BMI as an initial screening measure.
Considering Body Composition and Lifestyle Factors
Athletes might show high scores due to dense muscle rather than fat. Aging adults naturally lose lean tissue, skewing results over time. We recommend pairing this information with waist-to-height ratios and activity logs for balanced insights.
Your lifestyle choices—from sleep patterns to stress management—interact with genetic predispositions. Regular checkups help interpret categories through the lens of personal health history. Remember: one number starts conversations but shouldn’t end them.
Conclusion
Your health journey deserves clear markers, not guesswork. Our tool simplifies self-assessment by analyzing body weight relative to height, delivering instant insights into your wellness status. Whether using kilograms or pounds, the system aligns with global standards like the 18.5–24.9 healthy range.
Results highlight potential health problems linked to heart conditions or diabetes while acknowledging limitations. High muscle mass or age-related changes? We account for these variables in our explanations. Track changes over time to spot trends early.
Remember: numbers inform but don’t define you. Pair your score with lifestyle factors like activity levels and nutrition for a complete picture. If your body weight falls outside recommended ranges, consult a healthcare provider to explore personalized solutions.
Ready to take charge? Our resource offers data-driven clarity in seconds—no jargon, just actionable insights. Start your wellness check today and keep your health goals on track.


