How confident are you in understanding your little one’s development? Many caregivers assume regular checkups tell the whole story, but tracking growth patterns between visits matters just as much. That’s where tools like ours come in.
Body mass index (BMI) helps professionals assess how a child’s weight relates to their height. For infants and toddlers, though, standard charts don’t always apply. Our specialized resource uses age- and gender-specific percentiles from trusted health organizations to provide clarity.
We designed this solution to simplify monitoring for busy families. Input basic details, and get instant insights tailored to your child’s unique profile. Unlike generic tools, ours accounts for rapid developmental changes during early years.
Key Takeaways
- Growth tracking requires age-specific tools for accuracy
- Percentile-based analysis offers clearer health insights
- Instant calculations save time during critical development phases
- Regular monitoring helps identify patterns between doctor visits
- User-friendly design makes health management accessible
In the following sections, we’ll explore how this measurement works, why percentile-based evaluation matters, and how to interpret results effectively. Let’s empower your family with knowledge that grows alongside your child.
Understanding BMI and Its Role in Child Growth
Most parents don’t realize growth assessment tools work differently before kindergarten. Body mass index measures weight relative to height but requires special adjustments for children under five. Experts at the CDC stress that standard adult formulas don’t apply to rapidly developing toddlers.
Breaking Down the Numbers
Healthcare providers calculate body mass using this formula: weight (pounds) divided by height (inches) squared, multiplied by 703. For example, a 30-pound, 36-inch-tall child would have a value of (30 / 36²) x 703 ≈ 16.3. But raw numbers alone don’t tell the full story.
The Power of Percentiles
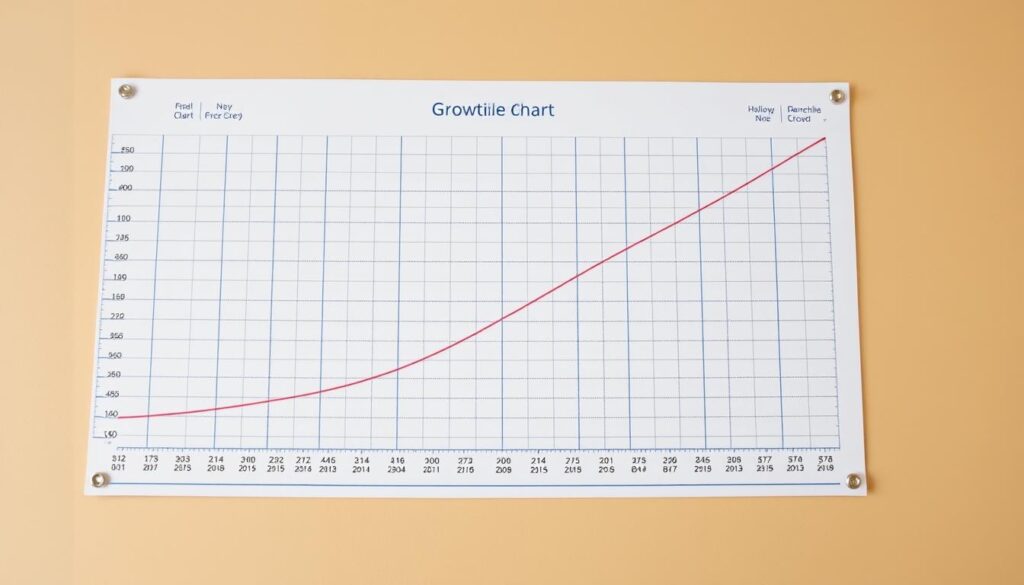
Growth charts from the NCCDPHP show how children compare to peers. A 60th percentile ranking means 40% of same-age children weigh more for their height. These rankings account for:
| Factor | Absolute Value | Percentile Approach |
|---|---|---|
| Age | Static number | Compares across age groups |
| Gender | Single calculation | Separates boys/girls data |
| Development Stage | Fixed result | Adjusts for growth spurts |
Boys and girls follow distinct growth patterns. A 3-year-old girl at the 85th percentile might need different attention than a boy at the same ranking. Regular tracking helps spot trends between checkups, empowering families to ask better questions during pediatric visits.
Our BMI calculator for kids under 5: How It Works
Understanding your child’s growth trajectory becomes straightforward with the right tools. We’ve built our resource to deliver precise insights using five essential data points. Let’s break down the process.
Required Information and Measurement Inputs
Accurate tracking starts with three details: birth date, sex, and current measurements. Parents enter:
- Exact date of birth (month/day/year)
- Height in inches or centimeters
- Weight in pounds or kilograms
- Date measurements were taken
Our system adjusts calculations for age in months and biological sex. A 28-month-old boy’s 32-inch height gets compared differently than a girl’s same measurement at 31 months.
Interpreting Your Child’s BMI Results
After processing, you’ll see three key outputs:
- Numerical value based on weight-to-height ratio
- Percentile ranking against national data
- Growth category (healthy, underweight, etc.)
A 90th percentile result means 90% of same-age children have lower values. Girls often show different patterns than boys – a 4-year-old girl at the 75th percentile might align with a boy at 65th. Minor rounding differences (
We plot outcomes on CDC growth charts during seasonal checkups. This visual approach helps spot trends. Remember: Percentiles matter more than absolute numbers during rapid developmental phases.
Tips for Tracking and Managing Your Child’s Growth
Regular monitoring helps families spot patterns that single measurements might miss. Start by reviewing percentile shifts every 2-3 months using reliable tools. This approach reveals whether changes align with typical developmental timelines or warrant professional input.
Translating Numbers into Action
Percentile trends matter more than isolated results. A jump from the 50th to 70th percentile in six months could signal rapid weight gain. Compare these shifts with growth chart guidelines to gauge if adjustments are needed. For example:
| Category | Stable Percentile | Rising Trend | Declining Trend |
|---|---|---|---|
| Nutrition | Maintain balanced meals | Review portion sizes | Increase calorie density |
| Activity | Daily playtime | Add structured exercise | Encourage movement games |
| Screen Time | 1-2 hours/day | Reduce by 15-minute increments | Monitor content quality |
| Sleep | 10-13 hours | Adjust bedtime routines | Evaluate sleep environment |
Building Healthy Routines
Use results to shape age-appropriate habits. Preschoolers need 3 hours of daily movement – mix free play with skill-building activities like hopping or catching. Pair this with colorful meals containing lean proteins and whole grains.
Sudden percentile drops or spikes lasting multiple months? Schedule a pediatric visit. Providers might suggest dietary tweaks or assess underlying factors like genetics. Early conversations prevent long-term health risks while respecting each child’s unique growth path.
Conclusion
Tracking your child’s growth patterns offers more than numbers—it reveals their unique health story. By combining weight-to-height ratios with age-specific percentiles, families gain insights that generic charts can’t provide. Our tool simplifies this process using CDC growth standards, helping you spot trends between pediatric visits.
Regular checks matter most during early years. A stable percentile range typically indicates balanced development, while sudden shifts might signal needs for dietary adjustments or activity changes. Boys and girls often follow distinct paths, making gender-specific comparisons essential.
We designed this resource to empower parents, not replace medical expertise. Share your results with healthcare providers to create action plans tailored to your child’s needs. Small changes in nutrition or playtime can make significant differences over time.
Ready to take charge? Use our precise calculation method today, then schedule a checkup if results fall outside typical ranges. Together, we can build healthier futures—one measurement at a time.


