As we age, our bodies change in ways that challenge conventional health metrics. For women navigating life beyond 50, understanding body composition becomes crucial—but how accurate are standard measurements at reflecting your unique health picture?
We’ve created a specialized resource that goes beyond basic number-crunching. Our guide combines a simple calculation method with expert insights from organizations like the CDC and Medical News Today. This approach helps you interpret results through the lens of hormonal shifts, muscle maintenance, and age-related metabolic changes.
While traditional height-to-weight ratios offer a starting point, they don’t tell the whole story. That’s why we focus on practical interpretation rather than rigid categories. You’ll discover how to assess results in context with other health indicators, from energy levels to mobility.
Key Takeaways
- Body mass index calculations adapt to age-related physiological changes
- Our tool simplifies complex health data into actionable insights
- Result interpretation considers muscle mass and fat distribution patterns
- Information sources meet rigorous medical accuracy standards
- Personalized strategies help maintain optimal wellness long-term
In the following sections, we’ll walk through using our assessment tool effectively. You’ll learn to identify key risk factors while celebrating strengths in your current health profile. Let’s redefine what healthy weight management means for your most vibrant years.
Overview: Understanding BMI and Its Importance for Women Over 50
Post-50, health assessments need fresh perspectives. Traditional tools often miss key changes in metabolism and body composition. This makes understanding weight-to-height ratios more than just number crunching—it’s about personalized health awareness.
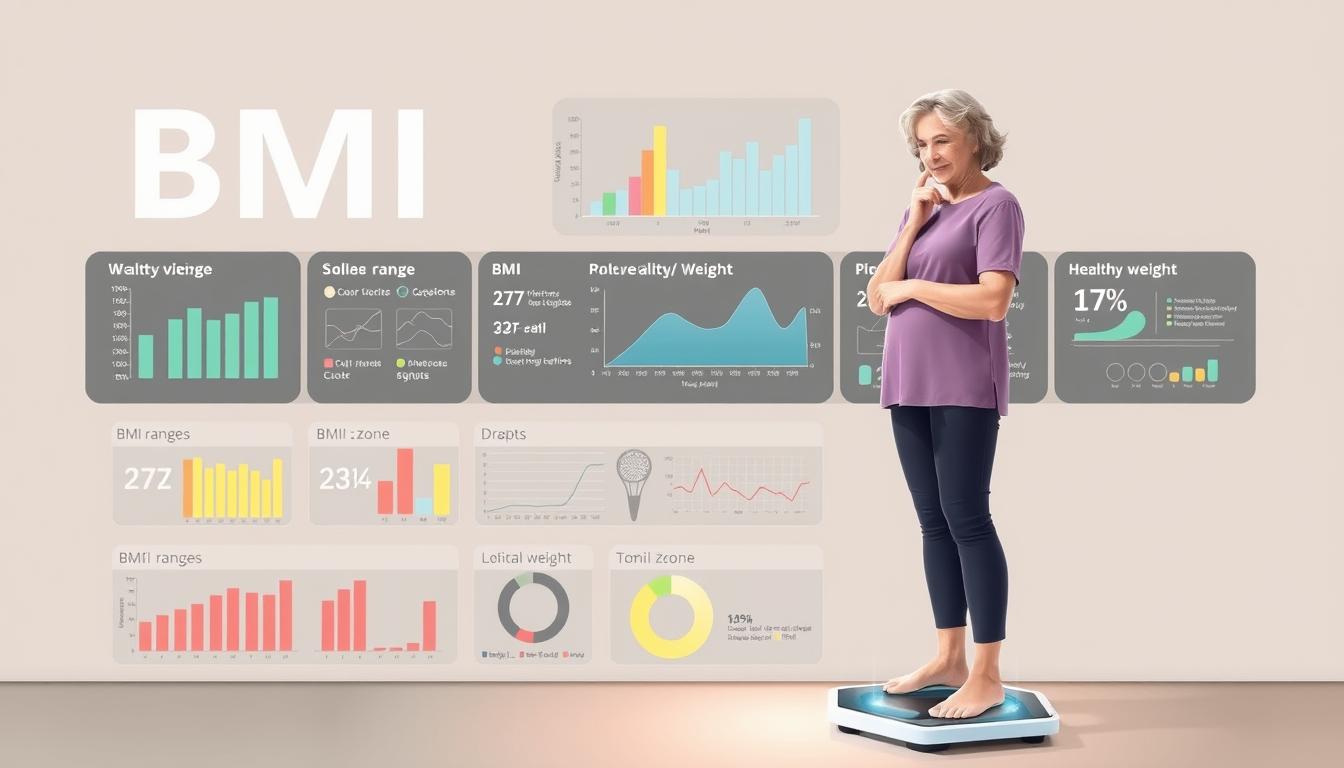
Defining BMI and Its Role in Health
Body mass index measures weight relative to height squared. Medical News Today notes it’s a screening tool, not a diagnostic one. For those in their 50s and beyond, hormonal shifts can alter fat distribution, making this metric a starting point rather than a final verdict.
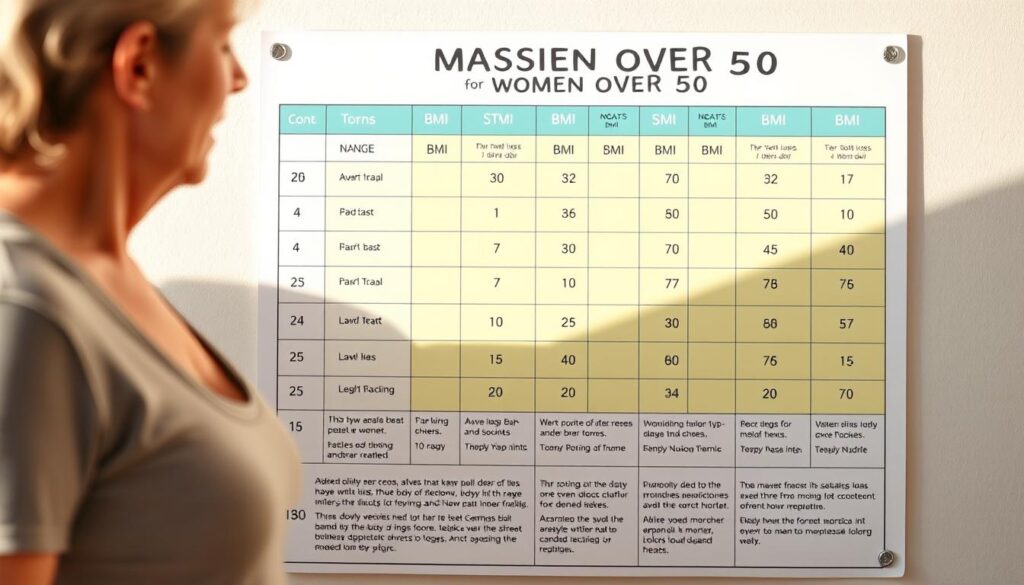
The CDC identifies four categories:
- Below 18.5: Underweight
- 18.5–24.9: Healthy range
- 25–29.9: Overweight
- 30+: Obesity
Evaluating Health Risks Associated with BMI Categories
Numbers outside the 18.5–24.9 range correlate with specific concerns. Higher scores may increase chances of heart disease or diabetes, while lower ones could signal nutritional gaps. However, muscle mass and bone density aren’t reflected here—a critical detail for active individuals.
We emphasize pairing this data with other markers like energy levels and mobility. It’s one piece of a larger puzzle, helping craft strategies that honor your body’s evolving needs.
Step-by-Step Guide: BMI calculator for women over 50
Precision matters when evaluating physical health markers later in life. We’ll walk through gathering essential data points and translating them into meaningful insights using trusted methods.
Preparing Your Baseline Numbers
Start with a calibrated scale and rigid measuring tape. Stand straight against a wall without shoes for height checks—measure to the nearest quarter-inch. For weight, step onto the scale first thing in the morning when hydration levels are most consistent.
Need metric conversions? Multiply pounds by 0.45 to get kilograms. Medical News Today confirms that even small measurement errors can skew results. Record numbers immediately to avoid memory gaps.
Translating Data into Actionable Insights
Enter your figures into our streamlined tool—no complicated math required. The system automatically applies the body mass index formula (weight in kg divided by height in meters squared). Results fall into four ranges:
- Below 18.5: Potential nutrient deficiencies
- 18.5–24.9: Typical metabolic efficiency
- 25–29.9: Increased cardiovascular considerations
- 30+: Elevated inflammation risks
Remember, these categories don’t account for muscle mass or bone density. Pair your score with waist circumference and energy levels for a complete picture. Our platform highlights personalized strategies based on your unique combination of metrics.
Understanding the Limitations of BMI
Health assessments often overlook critical nuances in body composition analysis. While body mass index provides a quick snapshot, it struggles to capture the full story of physical well-being—particularly for those experiencing age-related metabolic shifts.
When Numbers Don’t Tell the Whole Story
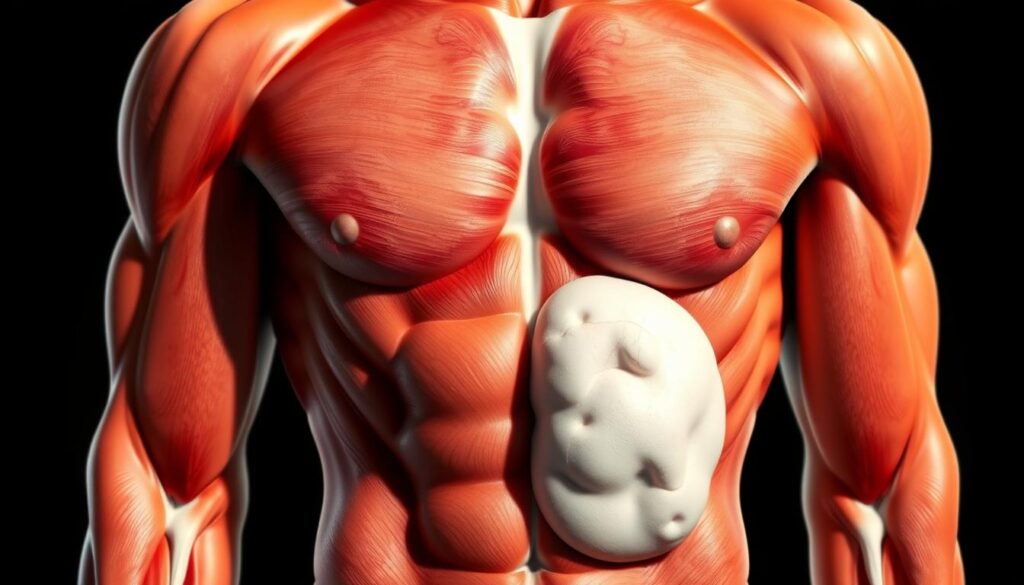
The NHS highlights a key gap: BMI calculations use height weight ratios without distinguishing fat from lean tissue. A study in JAMA found 30% of adults with “healthy” scores actually had elevated body fat percentages—a common pattern in postmenopausal women.
Consider these discrepancies:
| BMI Range | Potential Misclassification | Actual Health Status |
|---|---|---|
| 22-24.9 | Normal weight | High visceral fat (≥35%) |
| 26-27.9 | Overweight | Healthy muscle mass |
| 28-30 | Obese | Athletic build |
Muscle weighs more than fat by volume—a reality our tool accounts for through supplemental metrics. Those carrying extra weight kilograms in lean tissue might receive misleading categorizations using standard charts.
We recommend pairing your score with waist measurements and strength assessments. This approach helps identify hidden health problems like sarcopenia (muscle loss) that often accompany aging. While useful, BMI becomes truly powerful when combined with other diagnostic tools.
Additional Considerations Beyond BMI
Understanding wellness after 50 involves looking beyond basic metrics. While body mass index offers a general framework, it’s just one piece of the puzzle. Let’s explore tools that paint a fuller picture of health.
Waist Measurements and Ratios Matter
The CDC recommends waist circumference as a critical supplement to height-weight ratios. Excess abdominal fat—even with a normal mass index—increases heart disease and diabetes risks. For women over 50, aim for:
- Under 35 inches (88 cm) waist measurement
- Waist-to-hip ratio below 0.85
Research from a recent study shows these metrics better predict metabolic issues than BMI alone.
How Aging Reshapes Body Composition
Menopause shifts fat storage patterns, while muscle mass naturally declines. This dual change can skew BMI results. Consider these factors:
| Factor | Impact on BMI | Health Implication |
|---|---|---|
| Muscle loss | Underestimates fat | Higher chronic disease risk |
| Postmenopausal fat distribution | Overestimates risk | Misleading “overweight” classification |
| Bone density changes | No effect | Unaddressed fracture risks |
Pair your BMI with strength tests and mobility checks. This combo reveals more about actual healthy weight status than any single metric. As Medical News Today notes, “Multiple measures create actionable health insights.”
We encourage using our tool alongside these methods. Track trends over time—not just numbers—to build strategies that honor your body’s evolving needs.
Conclusion
Health journeys after 50 demand tools that adapt to life’s physical changes. Our resource simplifies tracking body mass index while acknowledging its role as one piece of your wellness puzzle. By measuring height-weight ratios and interpreting categories like 18.5–24.9, you gain insight into potential health risks—but always pair this data with waist measurements and strength assessments.
Medical experts agree: numbers alone can’t capture muscle-fat balance or metabolic shifts. That’s why we emphasize combining BMI with other markers. Explore targeted strategies that address body composition holistically, not just weight ranges.
Trust our guide to help navigate heart health, diabetes prevention, and healthy aging. Remember—optimal wellness isn’t about perfect scores, but understanding how your unique body mass interacts with lifestyle and biology. Revisit these insights often, and let them empower your decisions for years to come.


