For decades, healthcare professionals have relied on a straightforward calculation to assess body composition. This tool – created in the early 19th century – remains widely used today, but how much does it really tell us about wellness?
The body mass index compares weight to height through basic arithmetic. While not a direct measure of body fat, it helps identify potential health risks when paired with other assessments. Organizations like the CDC and WHO recognize its value in population studies, though they caution against using it as a standalone diagnostic.
We’ll explore how this measurement works across different units. For instance, someone weighing 180 pounds at 5’5” (65 inches) would use one equation, while another person measured in kilograms and meters would follow a modified version. These variations ensure consistent analysis worldwide.
However, this system has notable gaps. Athletic individuals with high muscle mass often get misleading results. Age and growth patterns also influence interpretations, especially for children and teens. That’s why experts combine it with waist measurements and blood tests for complete evaluations.
Key Takeaways
- Originated in 1832, this health assessment tool compares weight to height
- Works with imperial (pounds/inches) and metric (kilograms/meters) measurements
- Identifies potential risk categories but doesn’t measure body fat directly
- Requires additional tests for accurate individual health analysis
- Growth charts adjust calculations for younger age groups
Understanding Body Mass Index and Its Relevance
Health assessments often begin with a simple ratio of weight to height. This ratio, called body mass index, helps identify potential health patterns across populations. Major organizations like the CDC and WHO recognize its value for spotting trends, though they stress it’s just one piece of the wellness puzzle.
What This Measurement Tells Us
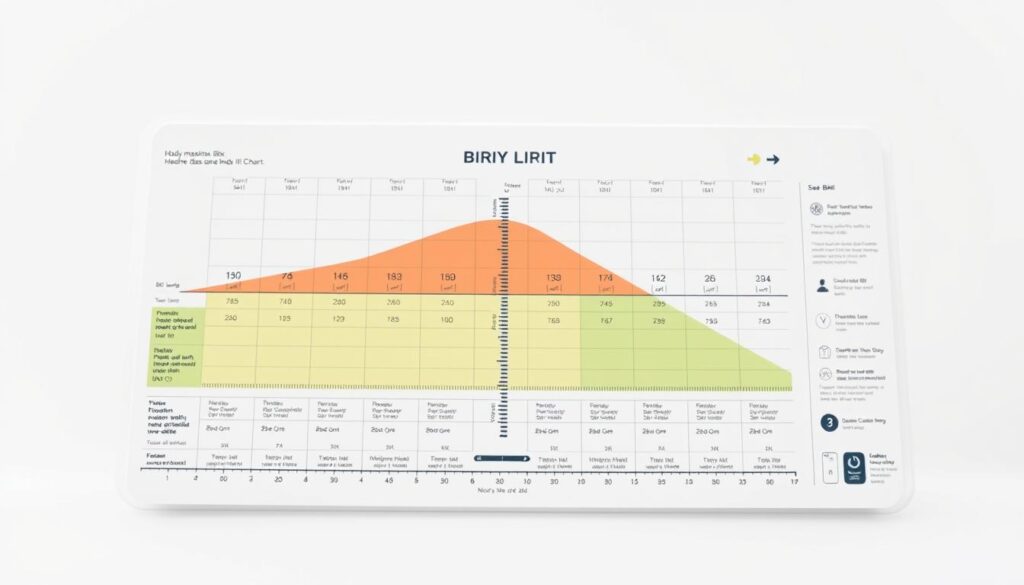
The body mass index categorizes individuals based on standardized ranges. Adults use fixed thresholds, while growth charts track developmental changes in children. These classifications help professionals spot potential risks linked to extreme weight-to-height ratios.
Measurements matter. Whether using kilograms and meters or pounds and inches, the calculation maintains consistency. A person’s result places them in categories that inform effective body composition strategies when combined with other data.
Where the System Falls Short
Muscle mass skews results. Athletes might show high scores despite low body fat. Age also plays a role – older adults naturally lose muscle, which the index doesn’t account for.
Health evaluations need context. While useful for groups, individual assessments require waist measurements, blood work, and lifestyle factors. We’ll break down the actual math next, showing how to apply it accurately.
Using BMI calculator formula: A Step-by-Step Process
Determining body composition begins with precise measurements. Whether using imperial or metric units, the process requires accurate weight and height data. Let’s break down both methods to ensure clarity.
Imperial Unit Method
For pounds and inches, multiply weight by 703 first. Divide this result by height squared. Take a 180-pound person measuring 65 inches tall:
- 180 lbs × 703 = 126,540
- 65 inches × 65 inches = 4,225
- 126,540 ÷ 4,225 ≈ 29.9
This places them in the higher range category. Always double-check unit conversions – mixing feet and inches creates errors.
Metric Unit Approach
Simpler math applies here. Divide weight in kilograms by height in meters squared. For someone weighing 81.6 kg at 1.65 meters:
- 1.65 × 1.65 = 2.72
- 81.6 ÷ 2.72 ≈ 30.0
Centers for Disease Control guidelines emphasize using exact measurements. Rounding numbers too early distorts results. Pair these calculations with waist measurements for fuller health insights.
Interpreting BMI Results and Health Implications
Understanding health metrics requires more than numbers—it demands context. Body mass index ranges act as starting points for evaluating potential wellness patterns. Let’s explore how professionals translate these scores into actionable insights.
Weight Categories and Population Patterns
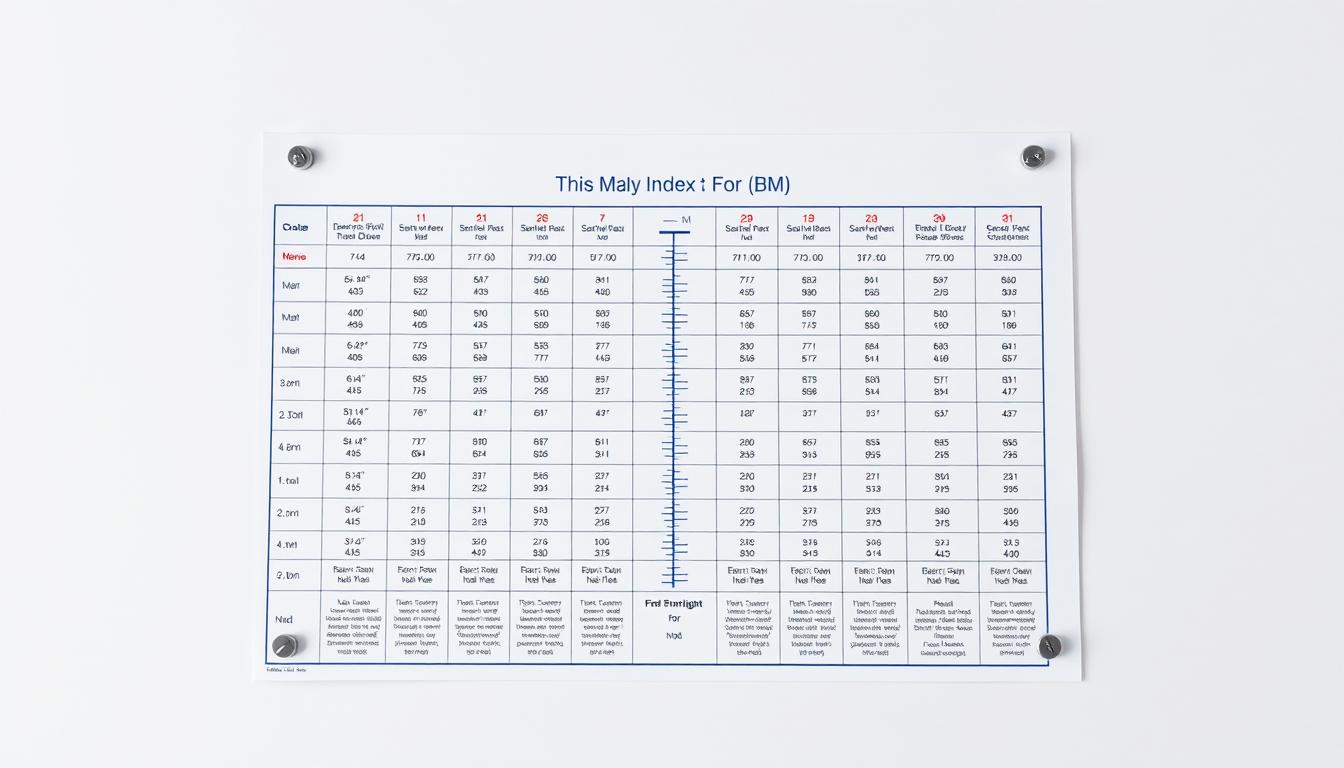
The body mass index system groups people into four primary classifications. These thresholds differ slightly between organizations but generally follow this framework:
| Category | Range | Potential Risks |
|---|---|---|
| Underweight | <18.5 | Nutritional deficiencies |
| Normal | 18.5–24.9 | Lowest disease likelihood |
| Overweight | 25–29.9 | Moderate risk increase |
| Obesity | ≥30 | High cardiovascular strain |
Connecting Dots Between Scores and Wellness
Extreme scores often correlate with specific conditions. Those below 18.5 face higher osteoporosis risks, while scores above 30 triple diabetes likelihood according to CDC data. However, muscle density and bone structure can distort these patterns.
Children’s growth charts tell different stories. Pediatricians track percentiles rather than fixed numbers, comparing youth to same-age peers. A 95th percentile score signals different concerns than adult classifications.
Putting Numbers in Perspective
While useful for spotting trends, these ranges don’t measure body fat directly. Athletes might show high scores despite lean physiques. Older adults often lose muscle mass, skewing results downward.
The Centers for Disease Control and Prevention recommend pairing these scores with waist measurements and blood tests. This multi-method approach provides clearer health pictures than any single metric alone.
Conclusion
Evaluating health through numbers requires balance. The body mass index remains a starting point for spotting patterns, but it’s just one piece of the wellness puzzle. We’ve shown how weight and height ratios work across pounds, inches, kilograms, and meters—tools that help millions track basic body composition.
Understanding these calculations matters. Whether using imperial or metric systems, precise measurements reveal potential risks linked to extreme scores. Categories like underweight or obesity serve as flags, not final diagnoses.
Remember: muscle mass, age, and bone structure influence results. Athletes and older adults often need additional checks like waist measurements or blood tests. The Centers for Disease Control and Prevention emphasize combining methods for accurate insights.
Use this guide to make informed choices, but always consult healthcare providers for personal advice. Health isn’t defined by a single number—it’s shaped by habits, genetics, and professional guidance working together.


