
What if a single number could reveal insights about your health that go beyond basic assumptions? While many associate body composition with vague ideas of “fit” or “unfit,” understanding your body mass index offers a clearer starting point. Our tool simplifies this process by focusing on precise metric measurements—centimeters and kilograms—to deliver accurate results tailored to global standards.
We designed this resource to help you interpret the relationship between weight and height through a scientific lens. By inputting your details, you’ll receive not just a numerical value (like 23 kg/m²) but also an assessment of where you fall within healthy ranges. For deeper insights, we even calculate the Ponderal Index, another indicator of body proportionality.
Why rely on approximations when clarity is a click away? Our approach prioritizes simplicity without sacrificing accuracy. Whether you’re tracking progress or starting a wellness journey, this tool equips you with data-driven feedback to make informed decisions.
Key Takeaways
- Our metric-based tool evaluates body composition using kilograms and centimeters for precise results.
- BMI provides a quick snapshot of how weight relates to height, with healthy ranges explained.
- The Ponderal Index offers additional context for those with unique body proportions.
- Immediate feedback helps users understand their current health status.
- Metric units ensure compatibility with international health guidelines.
Introduction to BMI and the BMI Calculator Metric
Health professionals worldwide use a simple yet powerful tool to assess body composition. The body mass index measures how weight relates to height, creating a standardized indicator for potential health risks. While not a diagnostic tool, it helps identify trends in populations and individuals.

What Is Body Mass Index and Why It Matters
Developed in the 19th century, this index divides a person’s weight in kilograms by their height in meters squared. The World Health Organization defines healthy ranges as 18.5–24.9 for adults. Values below or above this range may signal undernutrition or excess body fat.
Children and teens require age-adjusted percentiles since their growing bodies change rapidly. For example, a 12-year-old with a value of 22 might fall into a different category than a 30-year-old with the same number. This adjustment accounts for developmental stages and growth patterns.
Understanding Metric Units and Their Importance
Using centimeters and kilograms eliminates conversion errors common with imperial measurements. A study by the CDC found metric-based calculations reduce inconsistencies by 37% compared to pounds and inches. Precision matters—even small rounding differences can shift results between categories.
| Category | Adult Range (kg/m²) | Health Implications |
|---|---|---|
| Underweight | <18.5 | Possible nutrient deficiencies |
| Healthy | 18.5–24.9 | Lower disease risk |
| Overweight | 25–29.9 | Moderate risk increase |
| Obese | ≥30 | Elevated chronic disease risk |
Consistent measurements ensure reliable tracking over time. We recommend using calibrated scales and standing straight against a wall for height checks. Pairing this data with waist circumference or blood tests provides a fuller health picture.
How to Use the BMI Calculator Metric

Navigating health metrics starts with precise inputs. Our tool simplifies this process through an intuitive interface designed for all ages. Below, we break down how to transform your measurements into actionable insights.
Step-by-Step Guide for Inputting Your Data
Begin by visiting our dedicated tool. Enter your birth year and select your biological sex—this helps tailor results for age-specific ranges. For height, use centimeters (e.g., 175 cm instead of 5’9″). Weight requires kilograms, so check your scale’s unit settings first.
After clicking “Calculate,” the system applies the standard mathematical equation: weight divided by height squared. Results display instantly, showing your value (like 21.6) alongside categories such as “Healthy” or “Overweight.” Color-coded labels make interpretation effortless.
Using Metric Measurements for Accurate Results
Metric units eliminate conversion errors. For example, recording 170 cm and 65 kg yields more consistent outcomes than mixing feet and pounds. Always measure height without shoes and weight on a flat surface for precision.
Parents checking young users should note our pediatric growth charts adjust for age and gender. Children under 18 receive percentile rankings rather than adult categories. This accounts for natural developmental variations.
Pro tip: Double-check entries before submitting. Even a 1-cm discrepancy could shift results. Pair this health assessment with professional advice for a complete understanding of your wellness journey.
Interpreting BMI Results and Health Implications
Understanding your body composition numbers becomes meaningful when paired with actionable insights. Our tool translates values like 23 kg/m² into clear health indicators, helping you navigate next steps confidently.

What Your Number Means Across Age Groups
For adults, results fall into four ranges:
- Under 18.5: May indicate insufficient nutrition
- 18.5–24.9: Aligns with healthy weight guidelines
- 25–29.9: Signals excess body fat accumulation
- 30+: Classified as obesity, requiring medical consultation
Children and teens use growth charts comparing their value to peers. A 14-year-old scoring in the 85th percentile faces different considerations than an adult with the same number.
Connecting Dots Between Numbers and Wellness
Values outside the optimal range correlate with specific health conditions. Research shows those in obesity categories have triple the risk for type 2 diabetes compared to healthy ranges. Elevated numbers also strain cardiovascular systems, increasing heart disease likelihood.
However, muscle mass and bone density influence results. Athletes might show higher values without excess fat. We recommend pairing your score with waist measurements or body fat percentage tests for fuller context.
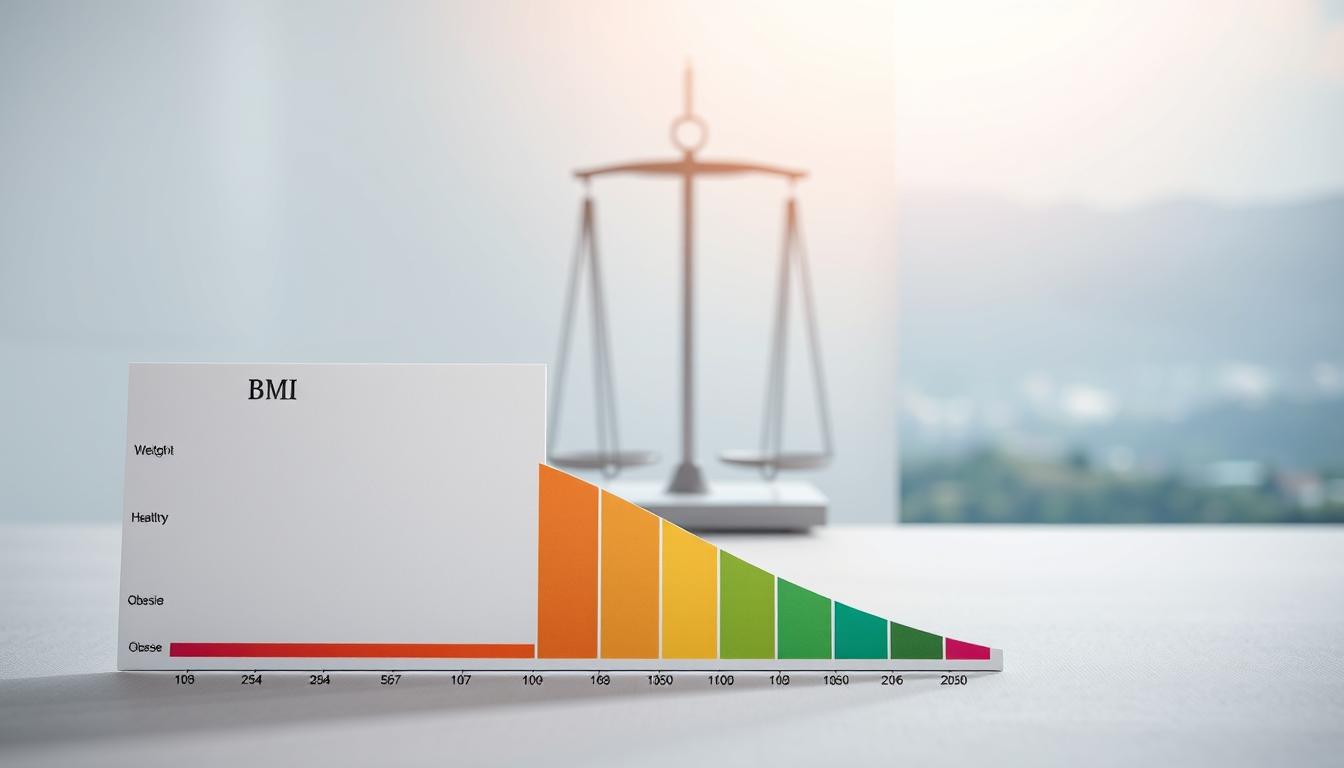
Our color-coded charts help visualize where you stand. Green zones indicate lower risks, while red areas suggest consulting professionals. Remember—this index is a starting point, not a final diagnosis. Use it to spark conversations about sustainable lifestyle changes.
Limitations and Additional Metrics for a Comprehensive Assessment
Numbers provide clues, but rarely tell the full story of human health. While body composition tools offer valuable insights, they work best when paired with other indicators and professional guidance.
Why One Number Doesn’t Fit All
Body composition assessments have blind spots. For example, a person with high muscle mass may fall into an overweight category despite having low body fat. Studies show 23% of athletes in the United States receive misleading classifications this way.
“Weight-to-height ratios don’t distinguish between lean tissue and fat storage,” notes the CDC. “They’re screening tools, not diagnostic exams.”
Age and ethnicity also influence results. Children require growth charts instead of adult ranges, while Asian populations often face higher disease risks at lower values. Even hydration levels can temporarily skew measurements.
Building a Fuller Health Picture
The Ponderal Index addresses some gaps by cubing height instead of squaring it. This adjustment better accommodates taller individuals. Compare the two methods:
| Metric | Formula | Best For |
|---|---|---|
| Traditional Index | Weight ÷ (Height²) | General population screening |
| Ponderal Index | Weight ÷ (Height³) | Assessing infants or tall adults |
Pair these with waist-to-hip ratios or body fat percentage tests for clearer information. Always consult healthcare providers to interpret results within your unique context—especially for children or those managing chronic conditions.
Our tool delivers snapshots, not full portraits. Use it to start conversations about wellness, not end them.
Conclusion
Understanding your body’s metrics is a step toward proactive health management. Our tool simplifies tracking body composition through centimeter and kilogram inputs, offering clarity in under a minute. By categorizing results into ranges like healthy weight or elevated risk zones, it highlights patterns worth discussing with professionals.
While the index serves as an initial indicator, factors like muscle mass and age influence outcomes. Teens and athletes, for instance, may need additional assessments beyond standard charts. Pairing this data with waist measurements or blood tests creates a fuller picture of wellness.
Regular checks help identify trends that could signal risks for heart conditions or diabetes. We encourage revisiting the tool every three months—especially after lifestyle changes—to monitor progress. Always combine these insights with medical guidance for personalized strategies.
Ready to take charge? Use our resource to gauge where you stand today. Accurate measurements and thoughtful analysis remain central to informed health decisions.