Is the number on your scale truly reflecting your well-being? While many focus solely on pounds or kilograms, health experts emphasize a more nuanced approach. The body mass index, paired with age-specific insights, offers a clearer picture of how weight impacts long-term wellness.
For decades, the Centers for Disease Control and Prevention has used this measurement to identify potential health risks. Our guide simplifies the math behind these calculations, whether you prefer metric units or standard measurements. We’ll show you how to interpret results through medical guidelines while considering life stage changes.
Age alters body composition—muscle mass decreases while fat distribution shifts. That’s why evaluating weight status requires more than basic arithmetic. Our breakdown includes alternative metrics like BMI Prime, helping you make informed decisions about nutrition and activity levels.
Key Takeaways
- Health assessments should account for age-related changes in body composition
- Medical authorities provide standardized tools for evaluating weight status
- Multiple measurement systems ensure accessibility for global audiences
- Supplementary metrics offer deeper insights beyond basic calculations
- Personalized strategies improve weight management effectiveness
Understanding BMI and Its Role in Health
What does your scale reveal about your health journey? Medical professionals use body mass index to evaluate how weight height ratios correlate with wellness. This measurement tool, endorsed by the Centers for Disease Control and Prevention, helps identify potential risks linked to body composition.
What Is Body Mass Index?
The mass index compares a person’s weight to their height using simple math. For metric measurements, divide kilograms by meters squared. In US units, multiply pounds by 703, then divide by inches squared. Both methods categorize results into four ranges:
- Underweight (below 18.5)
- Healthy (18.5–24.9)
- Overweight (25–29.9)
- Obesity (30+)
Key Health Indicators and Measurements
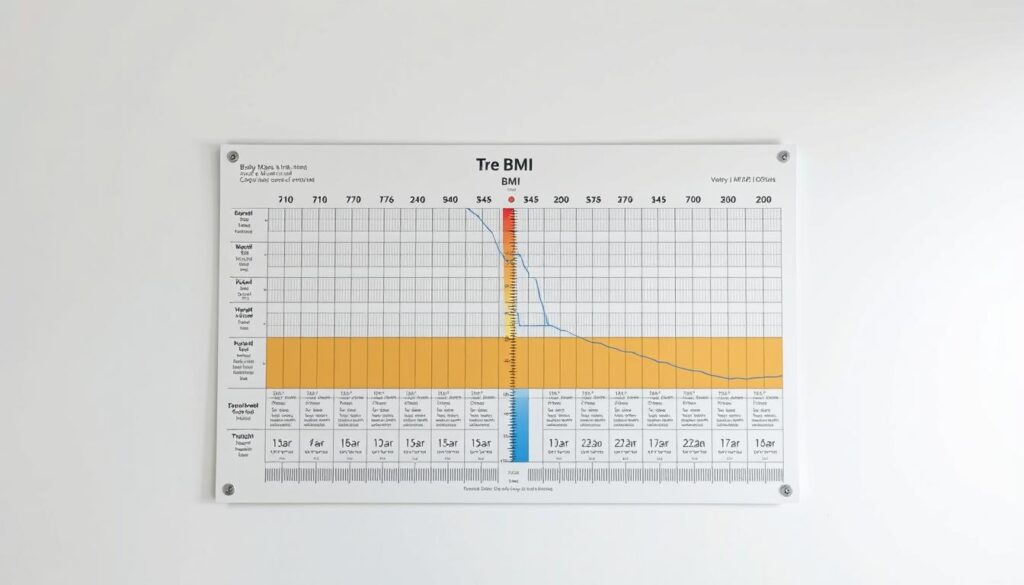
While height weight analysis provides a snapshot, body fat percentage and muscle mass refine the picture. Global health organizations like WHO use color-coded charts to simplify interpretations. These tools help spot trends in body composition assessment across populations.
Disease control initiatives rely on these metrics to shape public health strategies. For example, NIH data shows how shifting fat distribution impacts metabolic risks. We prioritize clear explanations of these scientific principles to empower informed health decisions.
Navigating the BMI calculator with age
How does your body’s story change as you grow older? Our analysis tools adapt to these biological shifts, offering personalized insights. Let’s explore practical methods for tracking wellness markers across different decades.
Simplified Measurement Process
- Choose your preferred measurement system (Metric/US)
- Enter current weight and height without shoes
- Select your age range from dropdown options
- Review color-coded results with explanation notes
Life Stage Considerations
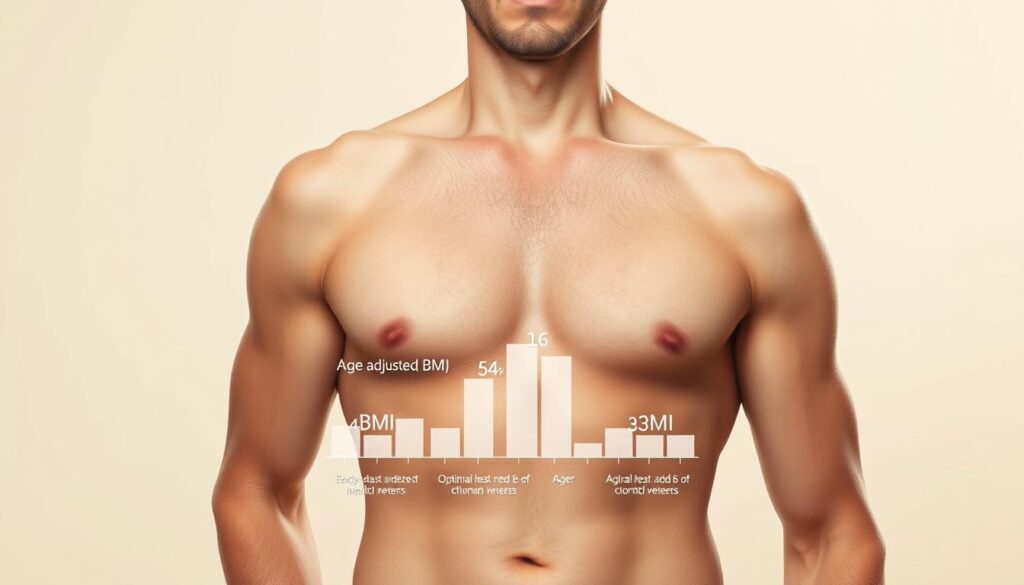
Muscle tissue naturally decreases 3-8% per decade after 30. This impacts how we interpret weight-to-height ratios. Our healthy weight assessment accounts for these changes through adjusted calculation models.
| Age Group | Muscle Mass % | Body Fat % |
|---|---|---|
| 20-30 | 42-46 | 21-24 |
| 31-50 | 36-40 | 26-29 |
| 51+ | 32-35 | 30-34 |
Measurement Flexibility
We support both pounds/feet and kilograms/meters. For precise results:
- Measure height against a flat wall
- Use calibrated scales first thing in morning
Combine these numbers with waist circumference for complete health picture. Our system automatically converts units while preserving accuracy.
Interpreting BMI Results and Health Implications
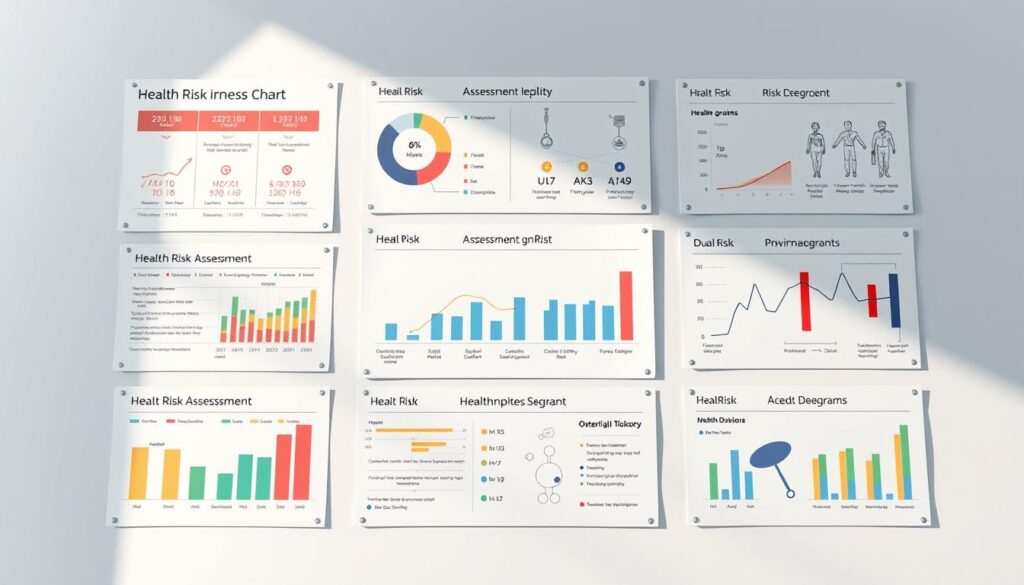
Your health data tells a story, but how do you read between the lines? Medical charts transform numbers into actionable insights. We help decode these measurements through trusted frameworks developed by global health authorities.
Weight Extremes and Their Consequences
A person falling below 18.5 on standard scales faces malnutrition risks. Those above 25 may develop cardiovascular strain. The health risks increase exponentially beyond 30, particularly for abdominal fat accumulation.
Children require specialized growth curves accounting for sex and development stages. Athletes often need adjustments for muscle content. Our tool flags these nuances through color-coded alerts.
Advanced Measurement Techniques
BMI Prime simplifies comparisons by dividing actual results by 25 (healthy threshold). A value of 1.3 signals 30% excess mass. The Ponderal Index uses height cubed instead of squared, better suited for very tall or short individuals.
| Category | Range | Health Impact |
|---|---|---|
| Underweight | Weak immunity | |
| Healthy | 18.5-24.9 | Optimal function |
| Overweight | 25-29.9 | Joint stress |
| Obesity | 30+ | Diabetes risk |
These charts help distinguish between lean tissue and adipose deposits. For example, two people at 28 might have vastly different body compositions. Regular monitoring helps catch trends before they become critical.
The Impact of Age on BMI and Body Composition
Why do pediatricians use different growth charts than adult health screenings? Body analysis tools must adapt as we progress through life stages. Our assessment tool recognizes these biological shifts through age-specific evaluation models.
Developmental Differences in Health Evaluation
Children’s growing bones and muscle development require specialized tracking. The CDC recommends percentile-based charts comparing youth to peers of the same age and sex. Baylor College researchers found teen athletes often show higher measurements due to muscle growth, not fat.
| Age Group | Chart Type | Key Factors |
|---|---|---|
| 2-19 years | Growth Percentiles | Bone density, puberty stages |
| 20-59 years | Standard Ranges | Muscle retention, fat distribution |
| 60+ years | Adjusted Scales | Metabolic changes, mobility |
Three critical factors alter readings across generations:
- Hormonal shifts during adolescence
- Bone mass peaks around age 30
- Metabolic slowdown after 40
Medical guidelines flag unusual composition changes that could signal nutritional issues or chronic conditions. For example, a 12-year-old at the 95th percentile needs different interventions than a 50-year-old with identical raw numbers.
Regular monitoring helps distinguish between healthy growth patterns and potential health risks. Our system cross-references multiple measurements to provide accurate status reports tailored to each life phase.
Conclusion
Understanding your body’s needs evolves through every life stage. Our analysis tools combine growth charts and unit conversions to create age-adjusted evaluations. Pediatric assessments differ significantly—growth percentiles help track development patterns for boys and girls compared to peers.
Accurate health evaluations require matching measurements to standardized categories. Reputable sources use data from decades of research to define risk thresholds. For adolescents, a 95th percentile result triggers different actions than similar numbers in adults.
Tracking activity levels and body composition helps manage excess body fat over time. Muscle-to-fat ratios shift naturally, making regular monitoring essential. Our guide simplifies these comparisons through visual percentiles and clear benchmarks.
Consult healthcare providers to interpret your data within personal contexts. Children’s categories consider bone density changes, while adults focus on metabolic patterns. Maintaining healthy activity levels supports balanced results across all age groups.
We prioritize actionable insights that address excess body fat risks through evidence-based strategies. Whether evaluating boys or girls, our tools adapt to life’s physical transformations. Start making data-driven decisions today—your future self will thank you.


