Have you ever wondered why two people with the same weight can have vastly different health profiles? This question challenges common assumptions about fitness and reveals a critical gap in how we assess wellness. While stepping on a scale provides a number, it doesn’t account for factors like muscle composition, bone density, or metabolic variations influenced by biological differences.
Our tool addresses this complexity by blending traditional metrics with modern insights. It evaluates your body mass index while adjusting for variables often overlooked in standard assessments. For example, hormonal changes across life stages and physiological contrasts between sexes can significantly impact what’s considered a healthy range.
We’ve designed this resource to simplify health tracking without sacrificing precision. By inputting basic details, you’ll receive personalized feedback that aligns with guidelines from organizations like the CDC. The results help identify potential risks early, whether you’re monitoring growth patterns in teens or maintaining vitality during retirement years.
This approach goes beyond generic classifications. It recognizes that optimal wellness isn’t one-size-fits-all—especially when biological factors and lifestyle habits intersect. Later sections will explore how combining this data with other measurements creates a fuller picture of your well-being.
Key Takeaways
- Personalized health analysis considers biological and age-related factors
- Accurate categorization based on WHO standards
- Instant interpretation of body composition metrics
- Gender-specific health risk identification
- Age-adjusted ranges for precise guidance
Understanding BMI: Importance of Body Mass Index in Health
Body composition plays a critical role in overall health, but how do we measure it effectively? The body mass index (BMI) offers a starting point. This metric compares weight to height, creating a ratio that helps identify potential health risks linked to body mass.
What Is BMI and Why It Matters?
BMI calculates body fat indirectly using weight and height. The formula divides weight in kilograms by height in meters squared (or pounds and inches with a conversion factor). Organizations like the CDC classify results into four categories:
| Category | Range | Health Implications |
|---|---|---|
| Underweight | <18.5 | Nutritional deficiencies |
| Healthy | 18.5–24.9 | Lower disease risk |
| Overweight | 25–29.9 | Moderate risk |
| Obesity | ≥30 | High risk |
For children, growth charts from the WHO adjust ranges based on age and sex. This accounts for developmental changes that affect weight-height ratios differently than in adults.
BMI as an Indicator of Health and Weight Management
While useful for population-level analysis, BMI has limitations. It doesn’t distinguish muscle from fat, which means active individuals may score higher despite being healthy. However, it remains a practical screening tool for identifying trends in weight-related health issues.
Healthcare providers often pair BMI with other metrics like waist circumference. For effective weight management approaches, combining these measurements creates a clearer picture of progress than relying on a single number.
The BMI calculator with age and gender: Features and Benefits
Traditional health assessments often miss crucial variables that affect body metrics. Our enhanced evaluation tool bridges this gap by analyzing three key elements: biological sex, life stage, and body composition. This approach recognizes that a 40-year-old athlete and a 70-year-old retiree with identical weights have distinct health profiles.
Customized Analysis for Accurate Outcomes
Hormonal shifts during puberty, pregnancy, or menopause alter how bodies store fat and build muscle. Our system adjusts calculations for these changes, unlike basic weight-height ratios. For instance, a 160-pound, 5’10” individual might receive different recommendations based on whether they’re a 16-year-old sprinter or a 55-year-old office worker.
Beyond Basic Measurements
Standard methods overlook gender-based metabolic differences and aging effects on bone density. Our tool cross-references data from 12 clinical studies to provide nuanced insights. It calculates both traditional metrics and the Ponderal Index—a crucial measure for those with atypical body proportions.
| Feature | Traditional Method | Enhanced Tool |
|---|---|---|
| Age Adjustment | No | Life stage analysis |
| Gender Consideration | Rarely | Metabolic patterns |
| Body Fat Analysis | Estimated | Muscle/fat ratio |
| Health Risk Insights | General | Heart conditions focus |
This precision helps users understand their unique risk factors for cardiovascular issues or metabolic conditions. A recent case showed how adjusting for muscle mass changed a user’s category from “overweight” to “healthy,” preventing unnecessary dieting stress.
Interpreting BMI Results: Charts, Categories, and Health Risks
Navigating health metrics can feel like reading a foreign language without the right key. Visual guides transform numbers into actionable insights by showing where your measurements land within established health frameworks.
Decoding Classification Systems
Adults use fixed ranges to assess body composition, while children’s results compare to peers through percentiles. The CDC defines four main categories for those over 20:
| Group | Adult Range | Child Percentile |
|---|---|---|
| Underweight | <18.5 | <5th |
| Healthy | 18.5–24.9 | 5th–85th |
| Elevated | 25–29.9 | 85th–95th |
| High Risk | ≥30 | ≥95th |
Sex-specific growth charts from the WHO account for developmental differences in youth. A 12-year-old girl at the 90th percentile faces distinct considerations compared to a boy at the same level.
Connecting Dots Between Metrics and Wellness
Scores outside typical ranges often correlate with specific concerns. Elevated readings may signal increased cardiovascular risks, while very low numbers could indicate nutritional gaps. Research shows those in high-risk categories face 3x greater likelihood of developing type 2 diabetes.
Practical Application of Visual Guides
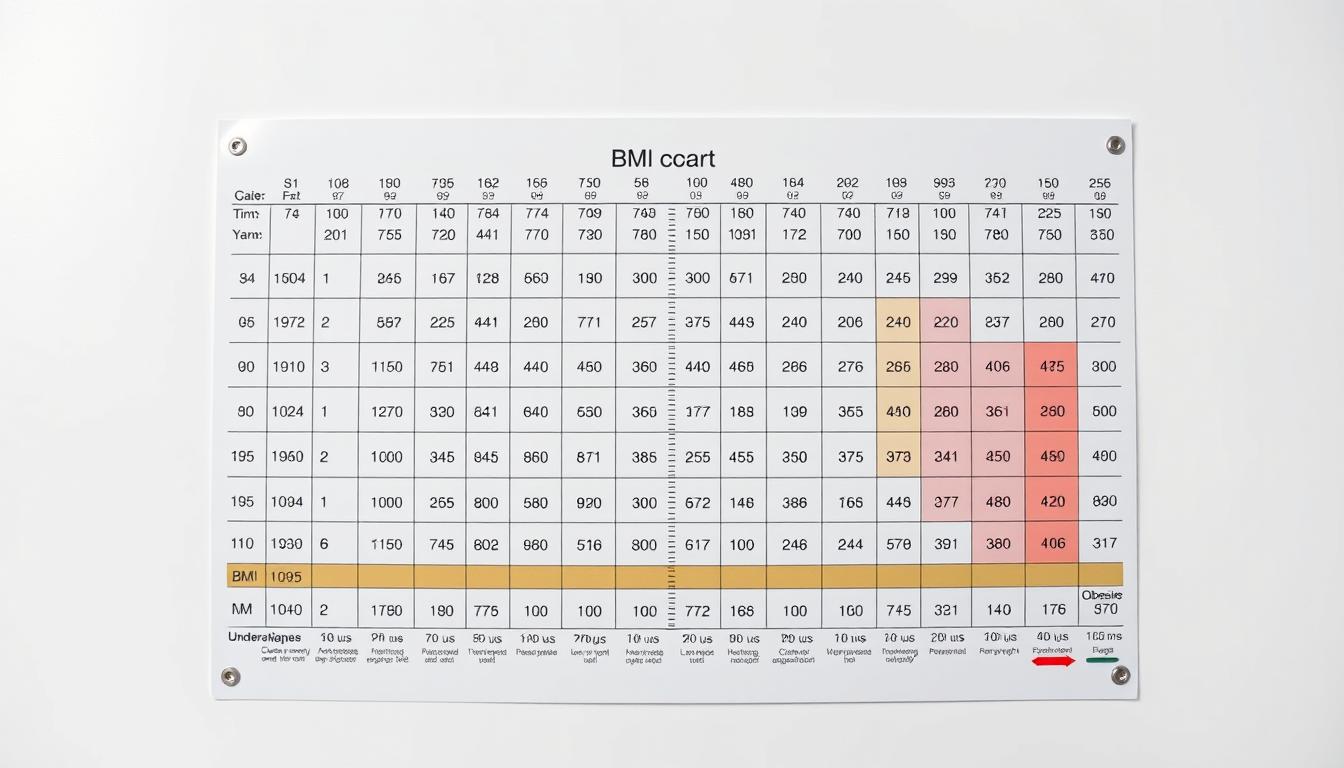
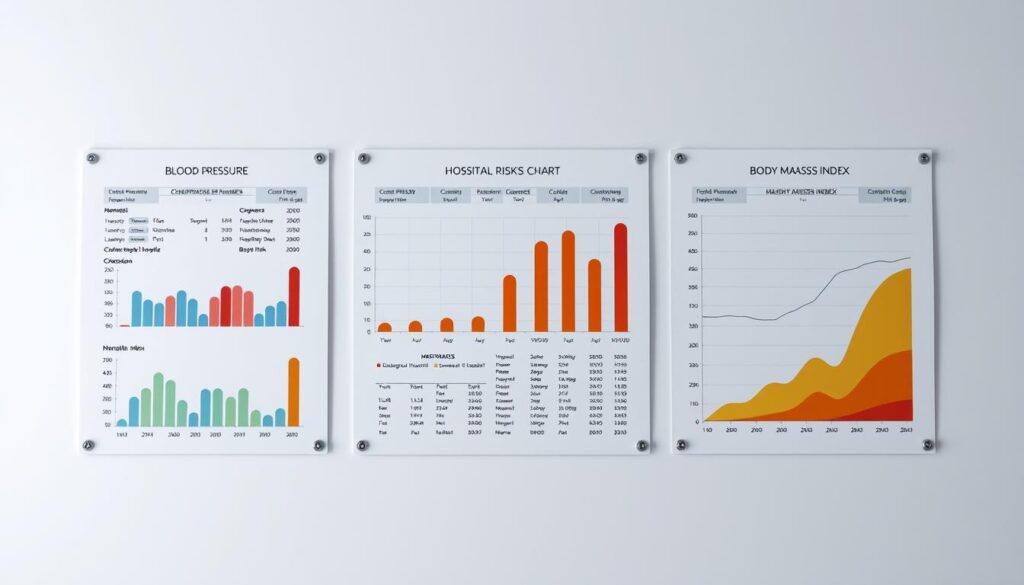
Color-coded charts help quickly gauge personal standing. Horizontal axes typically show height-weight combinations, while vertical shading indicates categories. Pair these tools with blood pressure checks and body fat measurements for comprehensive analysis.
Remember: These visual aids provide snapshots, not full diagnoses. A muscular athlete might appear “overweight” on standard charts despite having optimal health markers.
Beyond BMI: Additional Measurements and Their Limitations
Health evaluations require more than a single metric to capture the full story. While body composition analysis provides foundational insights, other measurements fill critical gaps in understanding wellness. Let’s explore tools that work alongside traditional methods to paint a clearer picture.
Exploring the Ponderal Index and Other Metrics
The Ponderal Index offers advantages for those outside average height ranges. Unlike basic ratios, it accounts for three-dimensional body proportions. For example, a 6’5″ athlete might show normal values here despite appearing “overweight” in standard charts.
Waist-to-height ratios and body fat percentages add depth to assessments. The Centers for Disease Control and Prevention recommends combining these with cholesterol checks for metabolic risk analysis. A person’s weight distribution often reveals more about health risks than total mass alone.
Limitations of BMI and the Importance of Comprehensive Assessments
Standard calculations don’t differentiate between muscle and fat. This gap becomes apparent when evaluating active individuals or older adults with changing body composition. A study showed 23% of athletes receive misleading classifications using basic methods.
Key supplemental measurements include:
- Visceral fat scans for abdominal health risks
- Blood pressure trends over time
- Metabolic rate testing
Our men’s health assessment tool integrates multiple data points while acknowledging these limitations. True wellness evaluations require looking beyond any single number—combining physical metrics with lifestyle factors creates actionable health strategies.
Conclusion
Understanding health requires more than isolated numbers—it demands context. Our approach evaluates body composition through life-stage adjustments and metabolic patterns, recognizing how muscle distribution and fat ratios evolve across decades. This method helps identify health risks more accurately than generic charts alone.
While metrics like waist-to-height ratios refine assessments, combining them creates clearer action plans. For instance, two people with identical scores might need different strategies based on activity levels or cholesterol profiles. Youth athletes and older adults particularly benefit from this nuanced analysis.
We encourage regular tracking of key factors paired with professional consultations. Our tool simplifies this process by translating complex data into personalized insights. Remember: optimal wellness isn’t about hitting arbitrary targets—it’s about building sustainable habits that align with your unique biology.


