We’ve all heard the term “ideal weight” tied to that familiar number from the body mass index. But here’s the catch: muscle doesn’t care about your BMI. The formula dividing weight by height squared was created in the 1830s for population studies – not individual health. Yet today, it’s used everywhere from doctors’ offices to online health tools.
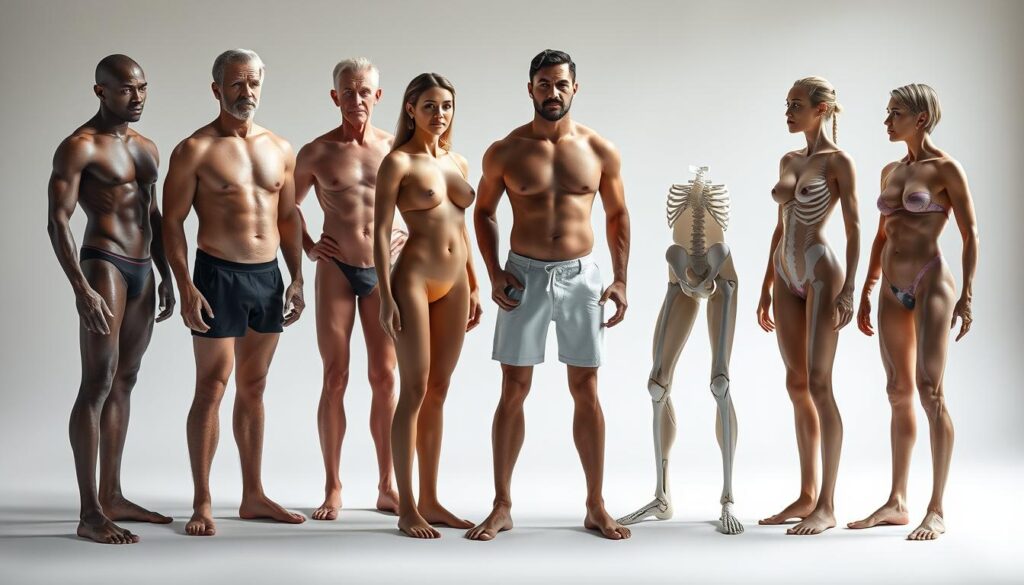
Consider this: two people can share identical height and weight but have radically different body compositions. One might carry dangerous visceral fat, while the other has dense lean tissue from years of training. The mass index labels them both the same – but which one is truly healthier?
Elite athletes like LeBron James often fall into “overweight” BMI categories despite having single-digit body fat percentages. Even active individuals lifting weights 3-4 times weekly can skew these measurements. This gap between reality and outdated metrics demands better solutions.
Key Takeaways
- BMI calculates health risk using only height and weight ratios
- Fails to distinguish between muscle mass and fat storage
- Athletes and active individuals often get misleading classifications
- Alternatives like waist-to-height ratios show stronger health correlations
- Body composition analysis provides more actionable insights
Modern tools like skinfold measurements and 3D body scanners now offer precise fat distribution mapping. While BMI serves as a quick screening tool, understanding its blind spots helps us make smarter decisions about what true health metrics really matter.
Understanding BMI and Its Limitations
For decades, a simple math equation has shaped how we view health. The body mass index remains a default screening tool, yet its limitations become clearer as science advances.
What Is BMI and How Is It Calculated?
BMI divides a person’s weight in kilograms by their height in meters squared. This creates four categories: underweight, normal, overweight, and obese. While useful for broad population trends, it’s like judging a book by its cover – quick but incomplete.
Key Flaws in Using BMI as a Sole Health Indicator
Muscle weighs more than fat, yet BMI treats them identically. A study of NFL players found 90% labeled “overweight” despite elite fitness levels. As obesity expert Dr. Scott Kahan notes: “BMI is a starting point, not a finish line.”
Other gaps include:
- Ignoring where fat is stored (visceral vs. subcutaneous)
- Overlooking bone density and age-related muscle loss
- Failing ethnic groups with different body fat patterns
Newer methods like waist-to-height ratios better predict heart risks. But until clinics adopt these widely, understanding BMI’s blind spots helps people advocate for fuller health assessments.
When Muscle Changes the Equation
When it comes to health metrics, context is king. The same scale number that signals concern for one person might represent peak fitness for another. This paradox stems from how we measure bodies versus how they function.
The Math Behind Misclassification
Consider Olympic sprinters and powerlifters. Many would register BMIs over 25 – technically “overweight.” Yet their health risks differ dramatically from sedentary individuals with identical scores. Why? Muscle density skews results while offering protective benefits.
Athletic populations highlight three critical gaps:
- Lean tissue weighs 18% more than fat per cubic inch
- Visceral fat (dangerous) vs. subcutaneous fat (less risky) aren’t differentiated
- Metabolic profiles of muscular individuals often outperform “normal” BMI groups
| BMI Category | Typical Body Fat (General Population) | Athlete Body Fat | Actual Health Risk |
|---|---|---|---|
| Overweight (25-29.9) | 25-31% | 8-15% | Low |
| Obese (30+) | 32%+ | 10-20%* | Variable |
*Examples: NFL linemen, heavyweight boxers
These discrepancies matter beyond sports. Active adults lifting weights 3x weekly can unknowingly enter “high-risk” categories despite improved metabolic markers. New research shows waist-to-height ratios better predict cardiovascular issues than BMI alone.
As one sports physician noted: “We’re using 19th-century math for 21st-century bodies.” Next-generation assessments now combine multiple metrics – a shift acknowledging that true wellness can’t be cubed into a single number.
Muscle Mass Versus Body Fat: Key Differences
Body composition tells a deeper story than any scale could. Two people with identical weights might have wildly different health profiles – one carrying dangerous fat stores, the other fortified with protective lean tissue.
Health Implications of High Muscle Mass
Studies reveal that individuals with greater lean tissue often defy BMI classifications. Research on athletes and active populations shows muscle-rich bodies correlate with:
- 31% lower diabetes risk compared to high-fat counterparts
- Improved insulin sensitivity, even at higher weights
- Reduced inflammation linked to chronic disease
| Group | Average Body Fat | Obesity-Related Risks |
|---|---|---|
| Trained Individuals | 12-18% | Low |
| Untrained Individuals | 25-35% | High |
Contrasting Body Fat and Lean Body Mass
Fat storage location matters more than total pounds. Visceral fat around organs drives metabolic issues, while subcutaneous fat poses fewer risks. Muscle acts as a metabolic furnace – burning calories even at rest.
Modern health assessments should measure both components. Tools like our body composition analyzer help identify true risks masked by outdated metrics.
Assessing Body Composition Beyond BMI
The quest for accurate health metrics has moved beyond simple math. While traditional calculations group all tissue as “mass,” advanced tools now map what that mass actually contains – revealing critical differences between fat stores and lean tissue.
Alternative Metrics: Body Fat Percentage and Lipometer
A 2023 study in the Journal of Clinical Nutrition found body fat percentage predicts blood pressure issues 43% more accurately than BMI alone. Devices like the Lipometer use infrared light to distinguish subcutaneous fat from visceral deposits – a game-changer for at-risk groups.
Consider these comparisons:
- Waist-to-height ratios over 0.5 signal heart risks better than BMI categories
- Skinfold measurements track fat loss progress missed by scales
- DXA scans reveal bone density changes crucial for older age groups
Dr. Lisa Sanders, Yale School of Medicine: “Combining three metrics cuts misclassification rates by 68% compared to BMI alone.” This layered approach helps active adults and seniors alike understand their true health picture.
Practical tools now exist for every lifestyle. Smart scales estimate body composition via electrical impedance, while fitness trackers monitor trends. For clinical precision, methods like air displacement plethysmography offer lab-grade accuracy without radiation.
Impact of Age, Gender, and Ethnicity on Body Composition
Our bodies tell unique stories shaped by more than just numbers. Biological factors like ethnicity, gender, and age rewrite the rules of what “healthy” looks like across populations.
Ethnic and Gender Specific Considerations
Research shows Asian adults face higher health risks at lower BMI scores compared to European groups. This led the WHO to recommend adjusted BMI cut-offs:
| Population | Overweight Threshold | Obese Threshold |
|---|---|---|
| European | 25 | 30 |
| Asian | 23 | 27.5 |
Gender differences also matter. Women naturally carry 6-11% more essential fat than men for reproductive health. Hormonal changes during menopause often shift fat storage to abdominal areas – a key risk factor often missed by basic metrics.
Age-Related Variations in Body Fat and Muscle
After 30, most adults lose 3-8% muscle mass per decade if inactive. Yet body fat tends to increase. This reversal explains why older people might need slightly higher BMI ranges for optimal health.
Consider these lifespan shifts:
- 20s-30s: Muscle peaks, metabolism fastest
- 40s-50s: Hormonal changes alter fat distribution
- 60s+: Sarcopenia (muscle loss) accelerates without strength training
A 70-year-old with a BMI of 27 could be healthier than a peer at 24 if they’ve maintained lean tissue. As one geriatric specialist notes: “We need age-adjusted benchmarks that recognize biological aging.”
Role of Strength Training in Managing Body Composition
Resistance training reshapes bodies in ways scales can’t measure. While many focus on calorie burning during workouts, the real magic happens afterward. Lean tissue acts like a metabolic engine, burning energy even at rest.
Benefits of Building Muscle for Overall Health
Regular strength workouts do more than sculpt physiques. Studies show they lower blood pressure as effectively as some medications. A 12-week program can reduce systolic readings by 4-5 points – enough to shift hypertension categories.
Here’s how resistance training transforms health markers:
- Boosts HDL (cholesterol) by 8-12% in sedentary adults
- Reduces visceral fat storage by 17% compared to cardio alone
- Improves insulin sensitivity within 72 hours post-workout
| Training Type | Weekly Sessions | Blood Pressure Impact | Cholesterol Change | Body Fat Reduction |
|---|---|---|---|---|
| Resistance Training | 3 | -5 mmHg | +10% HDL | 4.1% |
| Cardio Only | 5 | -3 mmHg | +5% HDL | 2.8% |
| Combined Approach | 4 | -6 mmHg | +12% HDL | 5.3% |
Take John, a 45-year-old office worker, as an example. After six months of lifting weights, his body fat dropped 6% despite minimal scale changes. His doctor noted improved blood flow and lipid profiles – results no BMI chart could predict.
This way of training becomes crucial with age. Adults maintaining strength routines preserve 40% more muscle mass post-50 compared to sedentary peers. As one trainer puts it: “Weights are the best insurance against aging’s stealth tax on our bodies.”
Screening Tools for Health Risks: BMI, Lipometer, and More
Health assessments have evolved beyond simple calculators to multidimensional snapshots of wellness. While older tools provided rough estimates, newer technologies reveal what’s happening beneath the skin.
Traditional Tools vs. Modern Precision
The body mass index remains popular for its simplicity but struggles with nuance. A 2024 study found BMI misclassifies 1 in 3 active adults as “higher risk” despite healthy fat distribution. Devices like the Lipometer use infrared sensors to map visceral fat – the dangerous type surrounding organs.
Key differences emerge:
- BMI: Calculates mass/height² – misses fat vs. muscle
- Lipometer: Measures subcutaneous and visceral fat layers
- Waist-to-height: Flags abdominal obesity better than BMI alone
Waist Measurements Reveal Hidden Dangers
Research shows waist circumference predicts heart issues 28% more accurately than BMI. For men, exceeding 40 inches (102 cm) signals higher risk – a threshold lower for some ethnic groups. Ratios comparing waist to hip or height account for body frame differences.
| Method | Strengths | Limitations |
|---|---|---|
| BMI | Quick population screening | Ignores muscle/fat differences |
| Waist-to-height | Detects abdominal fat | Requires precise measurement |
| Lipometer | Maps fat distribution | Less accessible than tape measures |
Practical approach: Combine waist measurements with body fat percentage checks. For active individuals, this duo catches 92% of true risk factors according to recent trials. As one researcher noted: “Two measurements beat one guess every time.”
Real-Life Examples and Case Studies
Numbers alone can’t capture the full picture of health. Let’s explore how real-world scenarios expose gaps in traditional measurement methods.
When Numbers Lie
A study of Germany’s Cobra police unit revealed startling contrasts. These elite officers averaged 22% body fat despite BMI scores labeling 38% as overweight. Their rigorous training built protective lean tissue – a factor no basic calculator accounts for.
Consider these comparisons between groups:
| Group | Body Fat % | Muscle Mass | Heart Risk | Bone Density |
|---|---|---|---|---|
| Cobra Officers | 15-22% | High | Low | +8% |
| Untrained Peers | 28-35% | Average | Moderate | Baseline |
LeBron James’ career data shows similar patterns. His BMI often nears 27 – technically “overweight.” Yet advanced scans reveal 6-8% body fat and exceptional heart efficiency. This disconnect highlights why single metrics fail active populations.
Three critical lessons emerge:
- Body fat amount matters less than type and location
- Muscle-rich individuals often have stronger bone structures
- Health risks vary widely within BMI categories
Dr. Angela Foster, sports physiologist: “We need tools that measure what muscles do, not just what they weigh.” Modern assessments combining waist measurements, DEXA scans, and blood markers now provide this depth – a shift benefiting athletes and everyday gym-goers alike.
Conclusion
Health evaluations demand tools that see beyond simple math. While mass-to-height ratios using kilograms offer quick population snapshots, they often misrepresent individual health conditions. Studies show identical BMI scores can hide critical differences in fat distribution and metabolic profiles.
Modern assessment methods like body fat scanners and waist measurements address these gaps. They reveal hidden problems like visceral fat accumulation – risks traditional formulas miss entirely. Gender and sex-specific variations further prove one-size-fits-all metrics fall short.
True health insights come from layered evaluations. Combining advanced tools with blood markers and lifestyle factors creates accurate risk profiles. This comprehensive assessment approach helps both professionals and individuals make decisions rooted in biology – not outdated arithmetic.


