What if the number on your scale isn’t the full story about your well-being? While many focus on hitting a specific target, your ideal range depends on more than just height. For individuals measuring 170 centimeters, the metrics that matter extend far beyond basic calculations—but how do you find clarity in conflicting advice?
We’ll simplify the science behind body metrics using trusted models like BMI, Devine, and Hamwi. These frameworks show variations between 53.5 kg and 72 kg, proving there’s no one-size-fits-all answer. Understanding your unique needs helps you prioritize energy levels, mobility, and long-term wellness over rigid goals.
Our guide combines data from medical studies and modern tools to create actionable steps. Whether you’re exploring nutrition, fitness, or lifestyle adjustments, we focus on sustainable habits that align with your body’s requirements. Let’s move past generic charts and build a plan tailored to you.
Key Takeaways
- Multiple formulas (BMI, Devine, Miller) calculate ideal ranges differently
- Health priorities go beyond numbers to include energy and mobility
- Ranges vary significantly—53.5 kg to 72 kg for 170 cm individuals
- Data-driven strategies adapt to age, muscle mass, and lifestyle
- Actionable steps focus on sustainable habits, not short-term fixes
Understanding Healthy Weight and Body Composition
Numbers tell stories, but not always the whole truth when it comes to wellness. Your ideal weight reflects a balance where your body operates efficiently, supports daily activities, and reduces health risks. This concept goes beyond aesthetics—it’s about energy, joint health, and metabolic function.
Why Body Composition Matters More Than Numbers
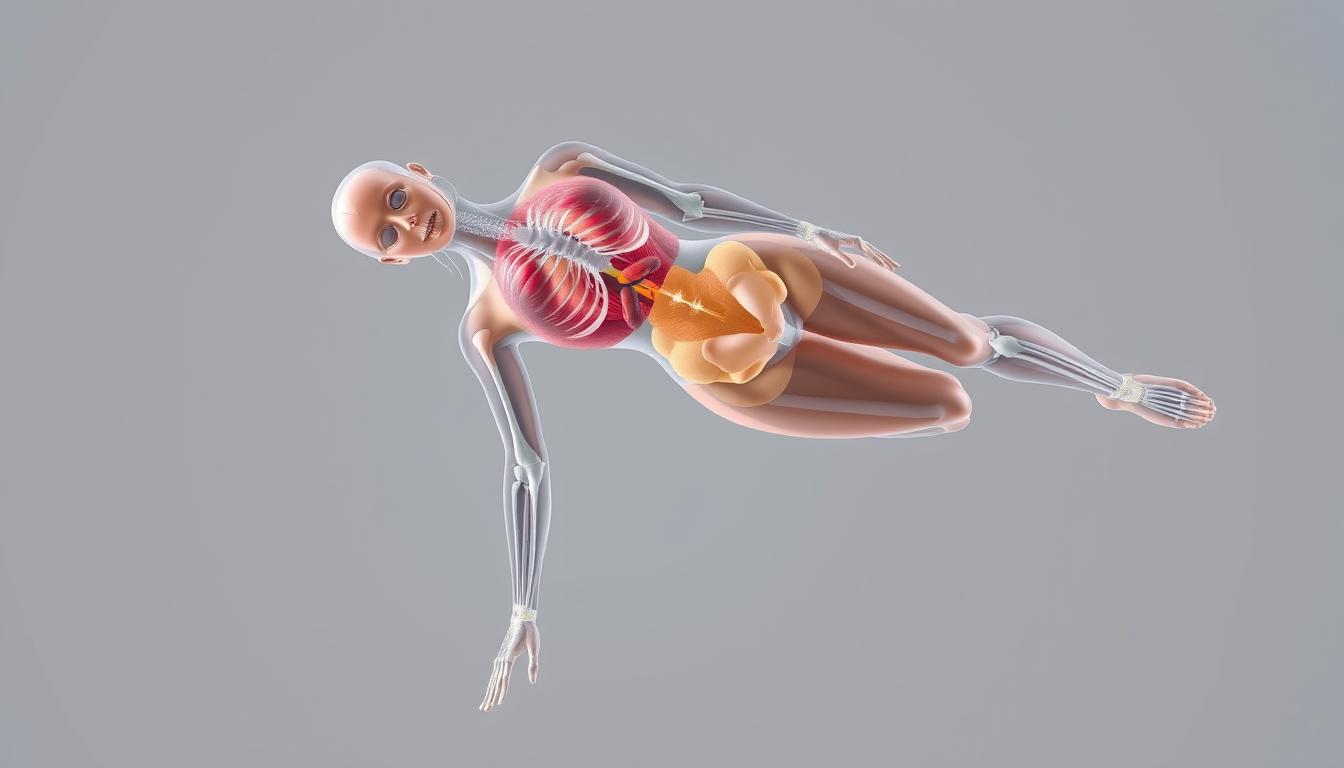
Body composition breaks down your mass into fat, muscle, and bone percentages. Two people at the same weight can have vastly different health profiles based on these ratios. A higher muscle percentage often correlates with better metabolic rates, while excess fat may increase chronic disease risks.
BMI’s Role—And Where It Falls Short
The body mass index (BMI) uses height and weight to categorize health risks. While helpful for population studies, it doesn’t distinguish muscle from fat. For example, athletes might show as “overweight” despite low body fat. Tools like body composition calculators add depth by analyzing these nuances.
Combining BMI with body fat percentage measurements offers a clearer view of your health. This dual approach helps set realistic targets that prioritize strength, endurance, and long-term vitality over rigid numerical goals.
Healthy weight for 170 cm female in kg
How reliable are single-formula answers for determining wellness targets? Multiple frameworks exist to calculate personalized ranges, each adjusting for unique biological factors. Let’s unpack four widely used models and their approaches.
Breaking Down the Formulas
The Devine formula, developed for medication dosing, uses height to estimate lean mass. Robinson’s equation refines this by accounting for age shifts. Miller’s method shortens height adjustments slightly, while Hamwi adds gender-specific multipliers. These variations explain why outputs differ:
| Model | Formula Basis | Range for 170 cm (kg) |
|---|---|---|
| Devine | Height + fixed ratios | 59.2–63.7 |
| Robinson | Age-adjusted height | 57.6–66.5 |
| Miller | Reduced height factor | 56.1–61.2 |
| Hamwi | Gender-specific | 58.5–67.8 |
BMI tools simplify this math by merging weight-height ratios into ranges like 18.5–24.9. As the CDC notes,
“BMI provides a quick snapshot but should pair with body composition analysis.”
Online calculators automate these equations, letting users input measurements for instant results. However, mass index formulas still prioritize averages—they don’t replace professional assessments. Verified tools, like those from medical institutions, factor in muscle density and bone structure.
Why trust one model? The answer lies in context. Athletes might favor Hamwi’s gender adjustments, while older adults benefit from Robinson’s age variables. Cross-referencing multiple frameworks creates a balanced perspective.
Factors Influencing Your Ideal Body Weight
Behind every weight recommendation lies a complex web of biological and behavioral influences. While formulas provide starting points, your unique physiology and daily choices ultimately determine where your body thrives.
Age, Gender, and Body Frame Considerations
Metabolism naturally slows by 3-8% per decade after 30, shifting energy needs. Muscle mass declines with age, while fat distribution patterns change—especially post-menopause for women. These shifts require adjusted weight targets over time.
Biological differences between men and women matter. Males typically carry 10-15% more lean mass, influencing baseline calorie requirements. Frame size—determined by bone structure and genetics—also sets natural ranges. A broad-shouldered individual may sit higher in healthy ranges than someone with a petite frame.
Lifestyle, Diet, and Fitness Habits
Daily routines create tangible impacts. Consider these evidence-backed factors:
- Activity levels: Sedentary lifestyles reduce calorie burn by 15-25% compared to active peers
- Sleep quality: Under 7 hours nightly disrupts hunger hormones, increasing risk of weight gain
- Diet composition: Protein-rich meals preserve muscle mass during weight management
Small habits compound over time. Walking 30 minutes daily burns ~150 calories—potentially preventing gradual yearly weight creep. Combining strength training with cardio maintains metabolic health better than either alone.
Using BMI, Waist Circumference & Height-Weight Charts
Common health metrics often raise more questions than answers. While BMI, waist measurements, and charts provide insights, their true value emerges when combined. We’ll show how to layer these tools for a complete health snapshot.
Interpreting BMI and Its Limitations
BMI sorts individuals into categories like underweight (below 18.5) or overweight (25+). However, it misses critical details. A rugby player with high muscle mass might score 27—technically “overweight”—yet have low body fat. Always pair BMI with body composition analysis.
| BMI Category | Range | Waist Circumference Threshold* |
|---|---|---|
| Normal | 18.5–24.9 | ≤ 35 in (women) |
| Overweight | 25–29.9 | ≥ 35 in (women) |
| Obese | 30+ | ≥ 40 in (men) |
*CDC guidelines for abdominal obesity risk
Navigating Height and Weight Charts for Accurate Assessment
Height-weight charts categorize ranges based on frame size. For example, a medium-framed 170 cm individual might fall between 58–68 kg. But these numbers assume average muscle mass. Athletes or older adults often sit outside standard ranges.
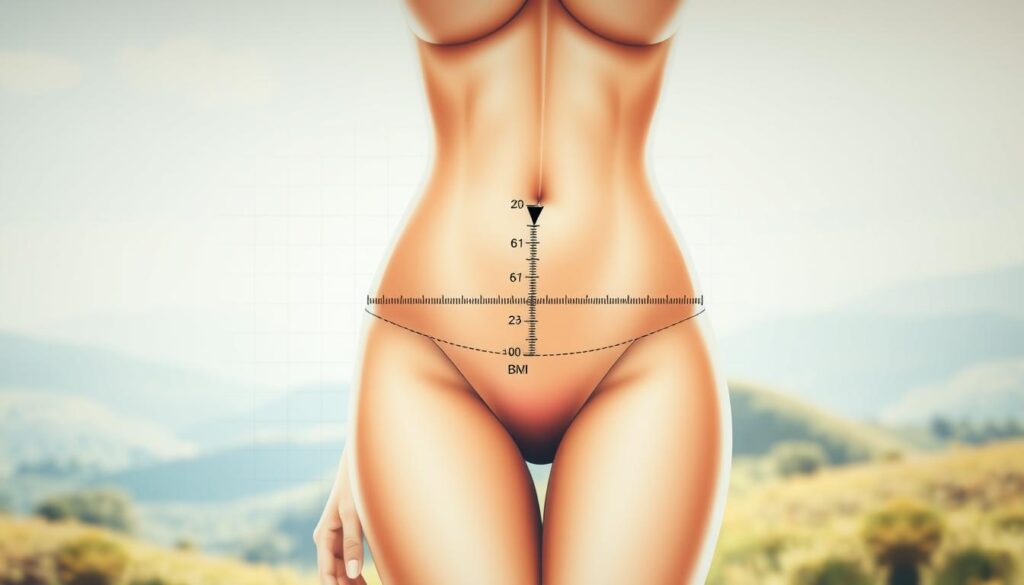
Waist circumference adds precision. Measure at the navel while exhaling gently. Values above 35 inches (women) or 40 inches (men) signal elevated health risks, regardless of BMI. Combine this with body fat percentage checks for clarity.
Online tools like the NIH Body Weight Planner merge these metrics. Cross-referencing data points reveals patterns invisible through single measurements. This layered approach helps tailor goals to your unique biology.
Practical Tips for Achieving and Maintaining Ideal Weight
Research shows that 80% of lasting success stems from daily habits, not quick fixes. Let’s explore three evidence-backed strategies to create momentum without drastic overhauls.
Nutritional Guidelines for Balanced Progress
Prioritize protein-rich meals (25-30g per serving) and fiber-filled vegetables to stabilize energy levels. Studies reveal this combo reduces cravings by 60% compared to low-protein diets. Swap refined carbs for whole grains like quinoa or oats to sustain fullness longer.
Movement That Builds Momentum
Combine strength training (2x weekly) with brisk walking (150 mins/week) for optimal results. This dual approach preserves lean mass while burning fat. The CDC confirms:
“Adults who mix cardio and resistance exercises maintain healthier body composition long-term.”
| Tool Type | Purpose | Example |
|---|---|---|
| Trackers | Monitor intake/activity | MyFitnessPal |
| Scanners | Analyze food labels | Yazio |
| Scales | Measure body fat % | Withings Body+ |
Smart Monitoring Systems
Use apps like Lose It! to log meals and sync with fitness trackers. Weekly weigh-ins paired with monthly body fat checks (aim for 21-33% for women) reveal true trends. Adjust portions by 100-200 calories if progress stalls for 3+ weeks.
Consistency beats intensity. Small daily improvements—like choosing stairs or drinking water before meals—compound into transformative results over months. Pair these tactics with patience for sustainable change.
Conclusion
True wellness begins when numbers empower rather than restrict. By combining tools like BMI, waist circumference checks, and detailed weight charts, we gain a clearer picture of our health. These metrics work best when layered with body fat analysis and lifestyle assessments.
Age, habits, and biological factors like gender shape our ideal range. Men often require different benchmarks than women due to muscle mass variations. Yet both benefit from focusing on sustainable habits—balanced nutrition, regular movement, and consistent monitoring.
Practical plans reduce obesity risks by addressing root causes. Programs blending fitness tracking with portion control create lasting change. Research confirms that those using multiple strategies maintain results 3x longer than quick-fix dieters.
Our collective health improves when we prioritize informed choices over rigid targets. Whether optimizing energy levels or preventing disease, small daily steps build resilient bodies. Let’s champion progress—not perfection—as we rewrite what true wellness means.


