What if everything you know about your ideal body is missing a key piece of the puzzle? While tools like BMI charts dominate conversations about health, they rarely address how factors like height and age shape what’s truly healthy for you. This article explores how these variables work together to create a personalized picture of wellness.
We’ll dive into the science-backed connections between body composition, life stage, and overall well-being. Instead of relying on outdated formulas, we use data from trusted sources like Medical News Today to highlight why a one-size-fits-all approach often falls short.
From waist-to-height ratios to metabolic changes over time, our guide provides actionable insights. You’ll learn how to interpret measurements while understanding that no single number defines health. Ready to move beyond generic advice? Let’s begin.
Key Takeaways
- Body composition varies significantly with age and height.
- BMI is just one tool among many for assessing health.
- Waist measurements often provide clearer health insights than weight alone.
- Metabolic changes during different life stages impact ideal ranges.
- Personalized assessments yield more accurate results than generalized charts.
Introduction to Our Guide on Ideal Weight
Navigating health goals requires more than just numbers on a scale. Our guide focuses on practical strategies backed by science, helping you understand how factors like body composition and metabolic shifts influence well-being.
Understanding the Importance of Weight Management
Balanced body mass supports energy levels, joint health, and disease prevention. While BMI offers a starting point, it doesn’t account for muscle density or fat distribution. Studies show waist measurements often predict health risks better than weight alone.
Our Approach to Health and Wellness
We combine multiple metrics with lifestyle insights for a complete picture. For example:
| Metric | Strengths | Limitations |
|---|---|---|
| BMI | Quick assessment | Ignores muscle mass |
| Waist-to-Height Ratio | Reveals visceral fat | Requires precise measurement |
Daily habits like mindful eating and strength training play critical roles. Our recommendations use data from institutions like the CDC to ensure accuracy without oversimplification. Next, we’ll explore how age and height refine these insights.
Understanding BMI and Other Health Metrics
Health assessments often begin with numbers, but what do they really tell us? While metrics like BMI offer snapshots of wellness, they’re just one piece of a larger puzzle. Let’s unpack how these tools work—and where they fall short.
What Is Body Mass Index (BMI)?
BMI calculates body fat using a simple formula: weight (lbs) divided by height (inches) squared, multiplied by 703. The CDC categorizes results as:
- Underweight: Below 18.5
- Normal: 18.5–24.9
- Overweight: 25–29.9
- Obese: 30+
Yet this index doesn’t distinguish muscle from fat. A 2023 NIH study found 22% of athletes register as “overweight” despite low body fat—a clear limitation.
Exploring Waist-to-Hip and Waist-to-Height Ratios
Waist measurements reveal what BMI misses. For women, a waist circumference over 35 inches signals higher heart disease risk, per American Heart Association guidelines. Waist-to-height ratios below 0.5 correlate with better metabolic health.
| Metric | Healthy Range | Best For |
|---|---|---|
| Waist-to-Hip | Below 0.85 | Assessing fat distribution |
| Waist-to-Height | Below 0.5 | Predicting cardiovascular risk |
These tools work best when combined. A 160-lb woman at 5’4” might have a “normal” BMI but carry dangerous visceral fat. Always pair numbers with lifestyle context for accurate insights.
Factors Affecting a Woman’s Ideal Weight
Determining a healthy body profile isn’t as simple as plugging numbers into a calculator. Biological traits, daily habits, and even DNA shape how muscle, fat, and bone interact uniquely in every person.
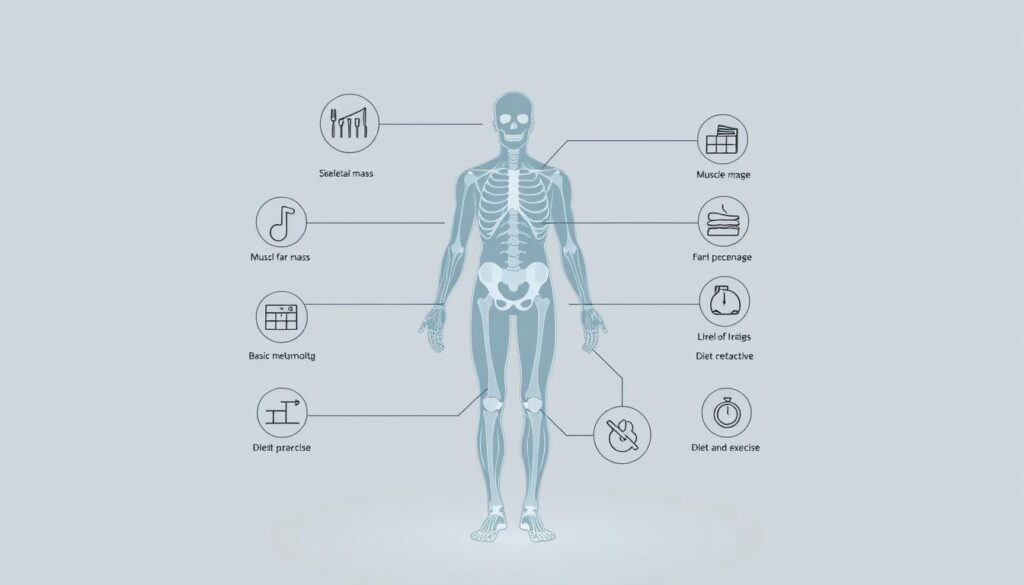
Role of Height, Age, and Body Composition
Taller frames naturally carry more muscle mass, while age influences metabolic rates. After 30, women lose 3-5% of lean tissue per decade, altering body composition. A 2023 NIH study notes:
“Genetic factors account for 40-70% of variations in body size—yet lifestyle choices determine how these predispositions manifest.”
| Factor | Impact | Limitations |
|---|---|---|
| Genetics | Sets baseline for fat storage | Doesn’t override diet/exercise |
| Activity Level | Builds calorie-burning muscle | Requires consistency |
Impact of Lifestyle and Genetic Factors
While genes influence where fat settles—hips versus abdomen—daily choices amplify or reduce risks. Research from Medical News Today shows women with waistlines over 35 inches face 2x higher diabetes odds, regardless of total weight.
Consider these interplays:
- High-intensity exercisers often weigh more due to dense muscle
- Sedentary jobs correlate with visceral fat accumulation
No single metric captures this complexity. Combining waist measurements with activity logs provides clearer health insights than BMI alone.
How to Calculate and Interpret Key Measurements
Accurate health insights start with precise measurements. Let’s break down practical methods to assess your body composition and understand what these numbers reveal.
Step-by-Step BMI Calculation and Its Limitations
To calculate BMI, follow these steps:
- Divide your weight in pounds by your height in inches
- Divide the result by your height again
- Multiply by 703
Example: A 150-lb person at 5’6” (66 inches) would compute (150 ÷ 66²) × 703 = 24.2. This falls in the “normal” range per CDC standards.
However, BMI ignores muscle mass and bone density. A 2023 NIH study found it misclassifies 1 in 4 active adults. Always pair this index with other metrics.
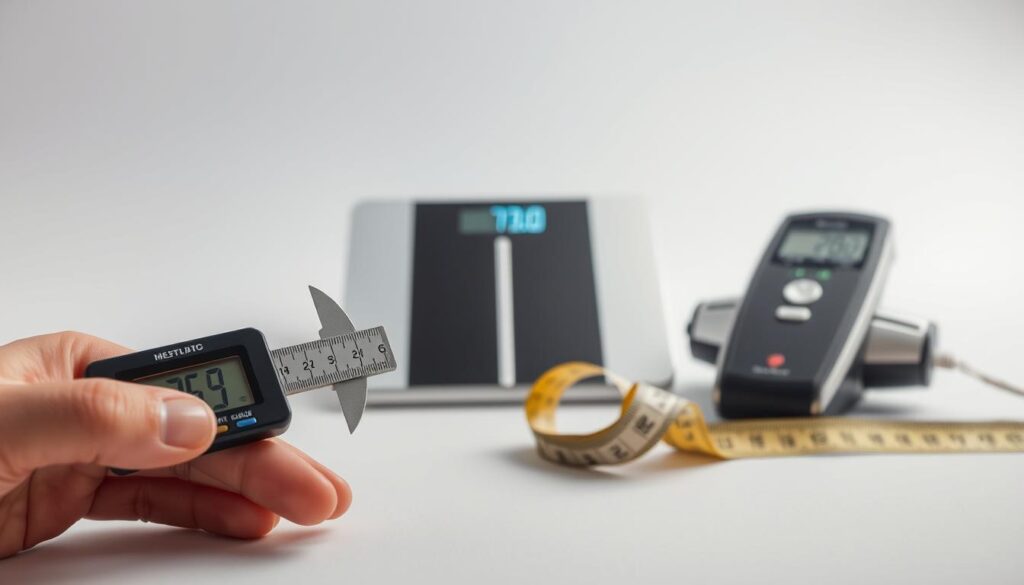
Using Charts and Tools to Measure Body Composition
NIH provides printable charts comparing weight ranges to height. For deeper insights:
- Skinfold calipers estimate body fat percentage
- Smart scales analyze muscle-to-fat ratios
- Waist tapes track visceral fat changes
Focus on trends over time. A 160-lb athlete might show 18% body fat (healthy), while a sedentary peer at the same weight could have 30% (risky). Combine height-weight ratios with these tools for a complete health snapshot.
Ideal Weight for Women by Height and Age: What It Means for You
Medical guidelines offer a roadmap, but your health journey needs a personalized compass. Research from institutions like the Centers for Disease Control and Prevention provides frameworks, while individual factors determine how to apply them.
Incorporating Medical Guidelines and Research
The CDC defines healthy weight ranges using population-level data. These benchmarks help identify risks like diabetes or heart disease. However, a 2023 study in Medical News Today clarifies:
“Body mass metrics become meaningful only when paired with personal health histories and lifestyle patterns.”
Consider these critical insights:
- Women with 25-31% body fat often have optimal metabolic function
- Muscle density can skew BMI classifications by up to 10%
- Waist measurements exceeding 35 inches signal higher risks, even at “normal” weights
| Guideline | Personal Factor | Action Step |
|---|---|---|
| BMI 18.5–24.9 | High muscle mass | Track body fat % |
| Waist | Genetic predisposition | Monitor visceral fat |
Numbers tell part of the story—energy levels, sleep quality, and mobility complete it. Use standardized metrics as starting points, not finish lines. Your unique biology and daily habits ultimately define what healthy looks like.
Weight Trends and Statistics Among American Women
Recent CDC data reveals shifting patterns in body composition across generations. While health risks often correlate with these trends, the numbers tell a layered story about aging populations and lifestyle impacts.
Average Weight Differences by Age Groups
Women aged 20-39 average 167.8 lbs, according to 2023 reports. This climbs to 176.4 lbs for those 40-59 before dipping to 166.8 lbs post-60. Three factors drive these shifts:
- Metabolic slowdown accelerates around 40
- Muscle mass declines 1% annually after 30
- Hormonal changes redistribute fat storage patterns
Current Obesity Rates and Their Implications
42.4% of adults over 20 now meet obesity criteria. Breakdown by age shows:
| Age Group | Obesity Rate | Key Risk Factors |
|---|---|---|
| 20-39 | 40.3% | Sedentary jobs, processed diets |
| 40-59 | 43.3% | Metabolic syndrome |
| 60+ | 39.8% | Mobility limitations |
Waist measurements over 35 inches appear in 56% of women 40-59—a critical marker for heart disease. As CDC experts note:
“Excess abdominal fat predicts mortality better than BMI alone, especially in midlife populations.”
These trends underscore the need for health strategies addressing life-stage challenges. While genetics play a role, actionable changes in nutrition and activity can alter trajectories at any age.
Practical Tools, Resources, and Lifestyle Tips
Practical strategies make health goals achievable without complex calculations. We’ve curated essential resources and daily habits that align with modern research.
Reliable Calculators and Visual Charts
Track progress using these verified tools:
- CDC’s Adult BMI Calculator for quick assessments
- NIH Body Weight Planner for personalized goals
- Printable waist-to-height ratio charts from AHA
These resources help spot trends over weeks or months. Pair them with effective BMI strategies for better accuracy.
Diet, Exercise, and Daily Habits for Maintaining a Healthy Weight
Small changes create lasting results:
| Habit | Benefit | Frequency |
|---|---|---|
| Meal prepping | Controls portions | Weekly |
| Strength training | Boosts metabolism | 3x/week |
| Hydration tracking | Reduces cravings | Daily |
Prioritize sleep (7-9 hours) and fiber-rich snacks. Nutrition labels reveal hidden sugars – aim for under 25g daily. Walk 8,000 steps to counter sedentary hours.
Conclusion
Understanding your body’s needs requires more than charts or single-number solutions. Health assessments thrive when combining metrics like BMI, waist measurements, and body composition analysis. These tools reveal how muscle mass, fat distribution, and lifestyle choices shape wellness uniquely for every person.
Age and genetics play undeniable roles. Data shows metabolic shifts after 30 and waist sizes over 35 inches correlate with higher risks—even at “normal” weights. Yet no universal standard exists. A 160-lb athlete and sedentary peer share a number but not a health profile.
Use medically reviewed resources—CDC calculators, AHA charts, and smart scales—to track trends. Pair these with professional guidance to interpret results. Remember: numbers inform decisions but don’t define worth.
Your journey thrives on personalized strategies. Revisit our tips on meal planning, strength training, and hydration. Share this guide to spark informed conversations about evidence-based health. Because thriving isn’t about fitting a mold—it’s about crafting your version of well-being.


