Ever wondered why some weight guidelines feel unrealistic for your frame? For individuals standing at 143cm, generic advice often misses the mark. This 143cm height weight chart guide cuts through the confusion, offering tailored insights for adults seeking clarity.
Weight management isn’t just about numbers—it’s about understanding your unique body composition and health needs. We’ll break down how tools like BMI calculations and the B.J. Devine formula (which suggests 45.5 kg as a baseline for this height) create personalized targets.
Our analysis draws from verified medical data, including weight ranges based on body measurements. You’ll discover why factors like bone density and muscle mass matter more than generic charts suggest.
Key Takeaways
- Tailored weight ranges for 143cm adults outperform generic guidelines
- BMI calculations provide health context beyond basic numbers
- The B.J. Devine formula offers specific benchmarks (45.5 kg baseline)
- Designed specifically for U.S. adults’ nutritional needs
- Actionable steps for interpreting and applying weight charts
Later sections reveal how to adjust these metrics for your lifestyle while maintaining optimal wellness. Let’s move beyond guesswork and into evidence-based strategies that actually work for your stature.
Understanding the 143cm Height Weight Chart
Navigating weight guidelines requires tools tailored to specific measurements. Body composition analysis and standardized metrics work best when calibrated for individual needs. This approach helps avoid generic advice that might misrepresent optimal wellness goals.
Core Measurements Explained
Health professionals use three primary metrics: body mass index (BMI), waist-to-hip ratio, and body fat percentage. For those measuring 143cm, BMI remains the most accessible tool. The World Health Organization defines a healthy weight range as a BMI between 18.5 and 24.9.
How BMI Informs Decisions
BMI calculates weight relative to height squared. A 143cm female, for example, falls within the normal category at 37.8–51.1 kg. The CDC classifies results as:
- Underweight: Below 18.5
- Normal: 18.5–24.9
- Overweight: 25–29.9
- Obesity: 30+
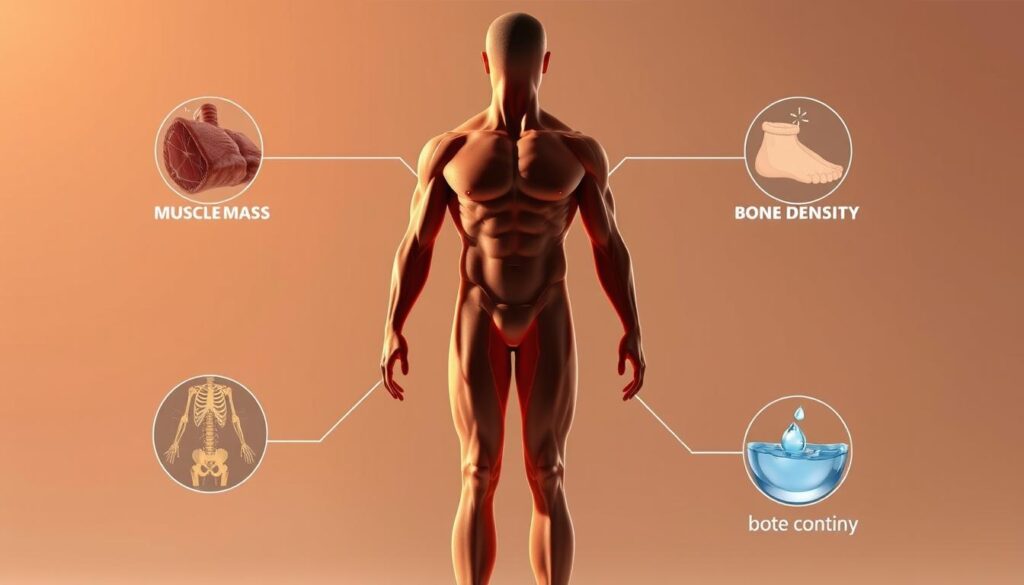
Muscle mass and bone density can skew BMI results. This explains why athletes might register as overweight despite being metabolically healthy. Always pair BMI with other assessments for a complete picture.
How to Use a 143cm height weight chart for Determining Ideal Weight
Personalized weight analysis starts with understanding how to interpret data correctly. Specialized charts designed for specific measurements remove guesswork while accounting for biological variables. Let’s explore how to translate numbers into actionable insights.
Step-by-Step Guide to Read the Chart
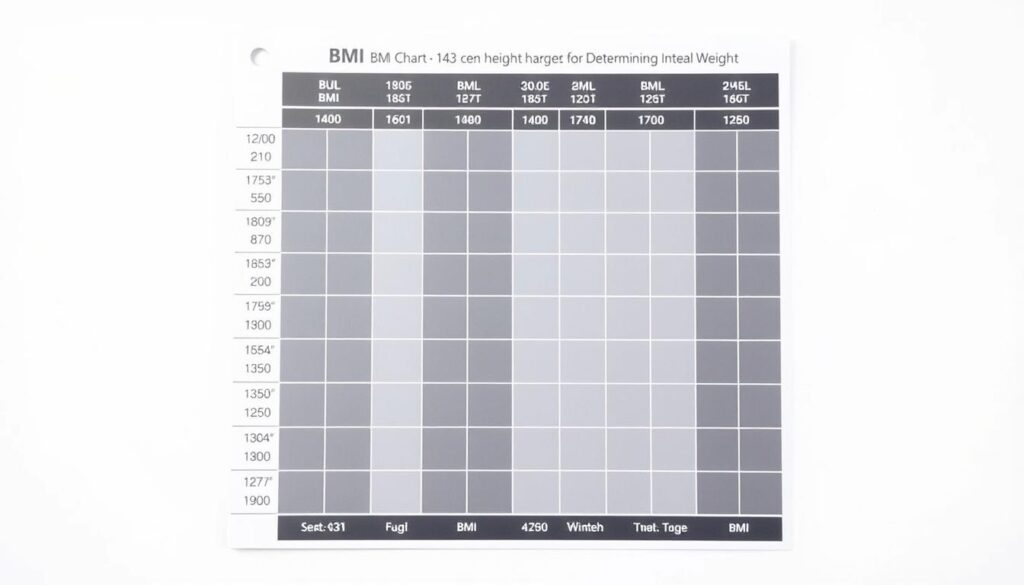
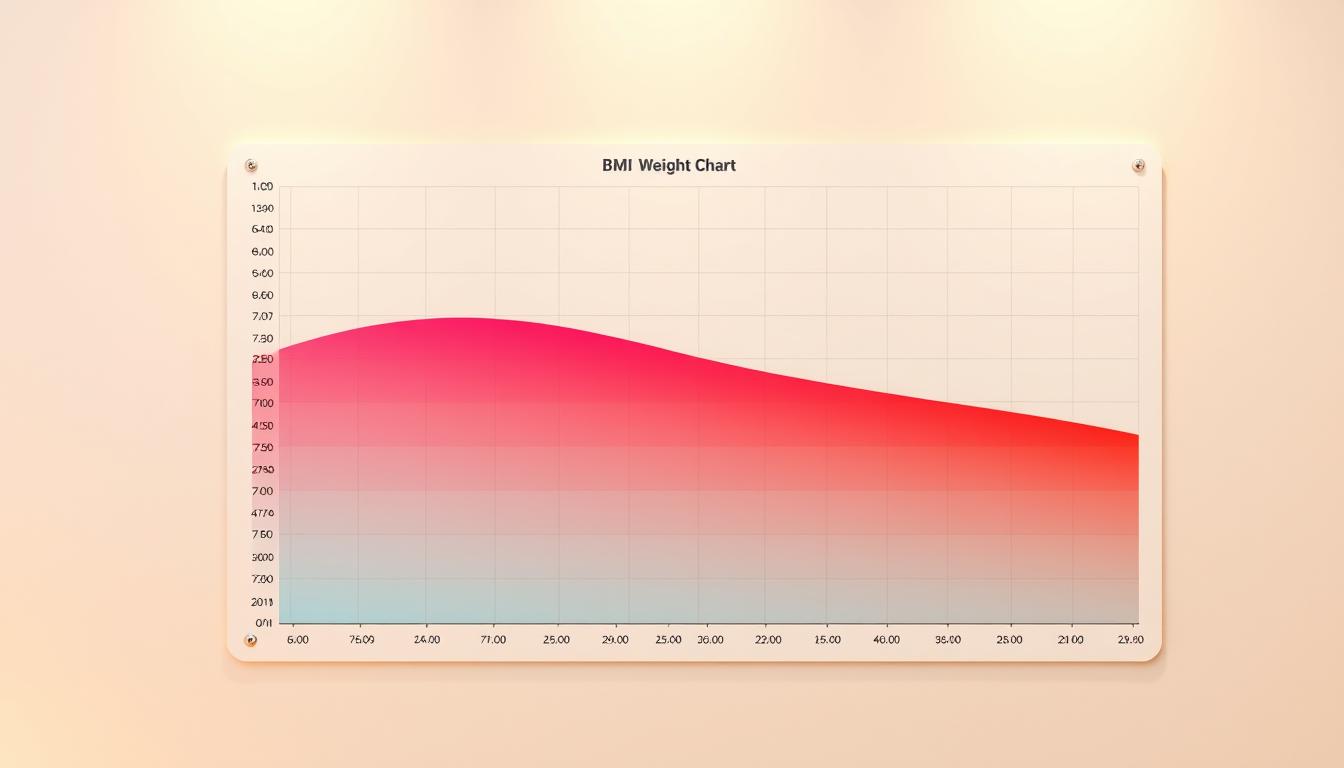
First, identify your current mass in kilograms. Locate this number on the vertical axis of the 143cm chart. Draw a horizontal line to intersect with the BMI curve. This intersection reveals your body mass index value.

Online tools simplify this process. Reputable calculators automatically generate results after inputting your details. For manual calculations, use this formula: BMI = mass (kg) ÷ (height in meters)2.
Interpreting Weight Categories Based on BMI
Compare your calculated BMI to standard categories. A value between 18.5–24.9 indicates a healthy weight range for most adults. Values below or above suggest adjustments might benefit overall wellness.
Consider these scenarios:
- 45 kg = BMI 22.1 (Normal)
- 52 kg = BMI 25.4 (Overweight)
- 40 kg = BMI 19.6 (Healthy)
Remember, muscle density and bone structure influence results. Athletic individuals might score higher without health risks. Pair chart data with professional assessments for personalized guidance.
Calculating BMI and Weight Range for 143cm Height
Precision matters when assessing wellness metrics. For adults at this specific measurement, customized calculations reveal more than generic charts. Let’s explore how professionals determine optimal ranges using two trusted methods.
Key Body Mass Index Formulas and Their Application
The BMI equation requires simple math: kilograms divided by height in meters squared. Convert 143cm to 1.43m first. A 48kg person would compute 48 ÷ (1.43 × 1.43) = 23.5 – within the healthy zone.
B.J. Devine’s approach suggests 45.5kg as a baseline for 5-foot individuals, adjusting by 2.3kg per additional inch. While not height-specific, this formula helps contextualize ideal weight when paired with body composition analysis.
Understanding Weight Categories
Health groups define ranges using standardized thresholds. The World Health Organization recognizes:
- 18.5–24.9: Healthy
- 25–29.9: Overweight
- 30+: Obesity
CDC standards mirror these brackets but stress considering muscle mass. A 52kg example yields 25.4 BMI – technically overweight but potentially healthy for athletic builds.
These tools offer guidance, not absolute rules. Combine numerical results with lifestyle factors and expert input to maintain a healthy weight range.
Implementing the Chart in a Healthy Lifestyle
Building sustainable habits starts with aligning daily choices to your body’s needs. The 143cm chart becomes most valuable when paired with practical strategies that support long-term wellness. Let’s explore how to translate its insights into real-world actions.

Fueling Your Body Strategically
Start with portion control using hand measurements – palms for proteins, fists for veggies. Prioritize nutrient-dense foods like leafy greens and lean proteins to maintain energy levels without excess calories. Studies show those who track intake through apps achieve healthy weight goals 30% faster.
Hydration plays a crucial role – aim for 8 cups daily. Swap sugary drinks for herbal teas or infused water. These small shifts create sustainable patterns that account for individual metabolic needs.
Movement That Fits Your Life
Incorporate activity naturally – take stairs instead of elevators, or try desk stretches during work breaks. The CDC recommends 150 minutes weekly of moderate exercise for health maintenance. Try these adaptable options:
- Brisk walking (burns 100+ calories per mile)
- Resistance band workouts (builds lean muscle)
- Yoga flows (improves flexibility and stress management)
Use digital tools to track progress – many smartwatches sync with weight management apps. Remember, consistency beats intensity. Pair movement with chart data to spot trends and adjust efforts.
Regular check-ins with your personalized chart help maintain motivation. Celebrate non-scale victories like improved stamina or better sleep quality. This holistic approach turns numbers into meaningful lifestyle upgrades.
Factors Influencing Body Weight Beyond the Chart
Weight management involves more than numerical charts. Biological variables and lifestyle factors create significant differences between individuals. Recognizing these elements helps build realistic expectations and personalized strategies.
Age and Sex Considerations
Metabolic rates shift with time. Research shows adults lose 3-8% of muscle mass per decade after 30. This impacts calorie needs and fat distribution patterns. Sex differences also play a role – female bodies naturally carry 6-11% more body fat than males for reproductive health.
- Hormonal changes during menopause often increase abdominal fat
- Males typically have higher muscle-to-fat ratios at similar body sizes

Importance of Body Composition and Muscle Mass
Two people at the same weight can have vastly different health profiles. A 60kg athlete with 18% body fat differs biologically from a sedentary individual at 60kg with 32% fat. Muscle tissue burns 3x more calories daily than fat, influencing metabolic health.
Standard charts don’t account for these variations. The National Institutes of Health notes BMI misclassifies 25% of athletes as overweight. Always pair numerical data with:
- Body fat percentage measurements
- Waist circumference tracking
- Strength and endurance assessments
Consider a 45-year-old female with high muscle mass. Her scale might suggest she’s overweight, but bloodwork and energy levels tell a different story. Individual context transforms raw data into actionable insights.
Trusted Tools and Formulas to Assess Weight
Practical tools transform abstract numbers into actionable health strategies. The B.J. Devine formula and modern calculators provide clarity for those managing weight 143 parameters. These resources work alongside standard charts to create personalized plans.
B.J. Devine Ideal Weight Formula Explained
This classic equation calculates baseline mass using height. For metric measurements:
- Convert height to inches (143cm = 56.3″)
- Subtract 60″ (5 feet): 56.3 – 60 = -3.7
- Multiply by 2.3: -3.7 × 2.3 = -8.5
- Adjust base weight: 50kg (men) or 45.5kg (women) ± result
A female example: 45.5kg – 8.5 = 37kg baseline. This serves as a starting point, not an absolute target.
Additional Calculators and Resources
Reputable tools refine your understanding of body mass metrics:
- CDC’s Adult BMI Calculator (auto-computes index scores)
- NIH Body Weight Planner (projects long-term results)
- MyFitnessPal (tracks nutrition alongside mass changes)
These digital aids account for activity levels and age. Cross-check findings with professional guidelines for accuracy.
Combining formulas with real-time data creates a complete picture. A 45kg example might show normal BMI but low muscle percentage. Use multiple tools to confirm trends and adjust goals accordingly.
Conclusion
Achieving health goals requires strategies tailored to your unique measurements. The 143cm chart provides clear benchmarks while accounting for critical factors like body composition and metabolic needs. By combining BMI calculations with the B.J. Devine formula, adults gain actionable insights into their healthy weight range.
Key takeaways include:
- BMI values between 18.5–24.9 indicate optimal wellness for most individuals
- Muscle mass and age significantly influence ideal weight targets
- Digital calculators from trusted sources simplify complex metrics
Maintaining wellness involves more than numbers. Pair your chart analysis with sustainable lifestyle habits and professional guidance. Consider how sex differences and activity levels impact results – a 45kg athletic build differs biologically from a sedentary counterpart.
Use tools like the CDC’s BMI calculator to track progress, but always consult healthcare providers for personalized plans. Ready to start? Review this guide’s strategies and leverage verified resources for health decisions that respect your body’s unique needs.


