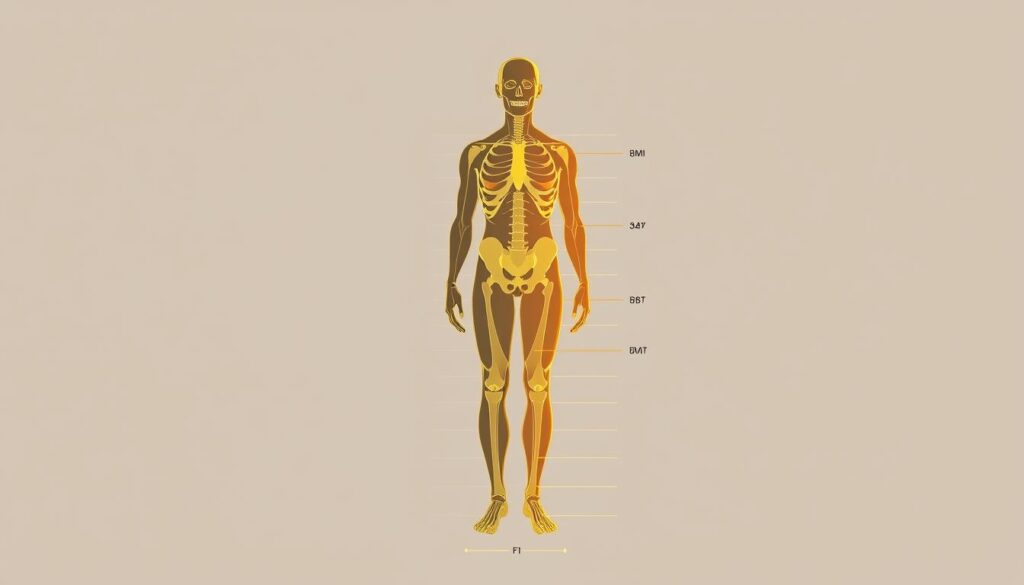
For decades, a simple calculation using height and weight has been the go-to method to assess health risks. But what if this number misses critical details about your overall wellness? We’re diving into two widely discussed metrics: the body mass index and the ratio of fat to muscle in your physique.
The body mass index (BMI) categorizes individuals into ranges like “underweight” or “obese” based on height and weight. According to the CDC, nearly 30% of adults fall into the “overweight” range. Yet, this system doesn’t account for muscle mass or bone density. For example, athletes often register as “overweight” despite having low fat levels.
In contrast, measuring fat distribution provides a clearer picture of health risks. Research shows that over half of people with a “normal” BMI still have elevated fat levels—a condition called normal weight obesity. This gap highlights why relying solely on one metric can be misleading.
Our analysis of BMI vs. body fat reveals surprising insights about which metric matters more. Let’s explore how these tools work, their limitations, and why understanding both could redefine your approach to wellness.
Key Takeaways
- BMI uses height and weight to categorize health risks but ignores muscle mass.
- High fat levels can exist even with a “normal” BMI, increasing disease risks.
- Body composition analysis offers a more personalized health assessment.
- CDC guidelines classify BMI ranges from underweight to obese.
- Athletes may have high BMI scores due to muscle, not fat.
Understanding BMI and Body Fat Percentage Metrics
Health assessments often focus on numbers, but which metrics truly matter? Let’s break down two key measurements that shape how we evaluate physical wellness.

Defining Body Mass Index and Its Ranges
The body mass index calculates weight relative to height. Using a simple formula (weight in pounds / height in inches² x 703), it sorts individuals into four categories:
- Underweight: Below 18.5
- Recommended: 18.5–24.9
- Overweight: 25–29.9
- Obese: 30+
While these ranges help identify population-level trends, they don’t distinguish between muscle and fat. A person with dense muscle might register as “overweight” despite having low fat stores.
Exploring Body Fat Percentage and Its Categories
This metric reveals what scales can’t—the actual ratio of fat to lean tissue. For men, essential fat starts at 2-5%, while women require 10-13% for basic bodily functions. Fitness expert Claire Edgemon notes: “Waist measurements over 35 inches for women or 40 inches for men often signal excess abdominal fat, regardless of weight.”
Ideal ranges vary by gender:
- Women: 21-24% (athletic), 25-31% (acceptable)
- Men: 14-17% (athletic), 18-24% (acceptable)
These differences highlight why combining multiple metrics creates a clearer health profile than relying on one number alone.
Evaluating BMI and body fat percentage for Accurate Health Assessment
Numbers on a chart rarely tell the full story. While standardized measurements provide a starting point, true wellness evaluation requires deeper analysis of how different markers interact.

Hidden Dangers in Seemingly Normal Results
A 2023 JAMA study found that 30% of adults with “healthy” weight classifications had elevated fat levels. These individuals faced double the risk of insulin resistance compared to peers with balanced muscle-to-fat ratios. Conditions like heart disease and diabetes often develop silently in this group.
Traditional screening tools miss these risks. “We’ve seen patients with perfect weight charts but alarming metabolic profiles,” notes Dr. Alicia Cohen, a researcher cited by the Centers for Disease Control. Her team’s longitudinal data shows combining measurements reduces diagnostic blind spots by 40%.
When Appearance Deceives
Normal weight obesity affects 1 in 4 women over 35, according to CDC reports. This condition—where fat accumulates around organs despite normal scale numbers—increases inflammation and hormonal imbalances. Men with similar profiles show higher rates of liver complications.
Our interactive health calculator helps identify these mismatches. By comparing your metrics against population data from the Disease Control Prevention database, you gain actionable insights tailored to your age and gender.
Key findings from recent studies:
- Visceral fat increases stroke risk 3x more than overall weight
- Muscle mass preservation lowers diabetes likelihood by 60%
- Waist-to-height ratio predicts heart issues better than BMI alone
Modern Measurement Techniques and Their Limitations
New tools promise precise health insights, but how reliable are they? Let’s examine the latest approaches to evaluating physical composition and their practical challenges.
Common Methods and Their Accuracy in Measuring Body Fat
Skinfold calipers remain popular due to low cost and portability. By pinching specific areas, practitioners estimate fat stores with up to 8% error margins. “These measurements depend heavily on technician skill,” warns a 2022 CDC report. Home scales using bioelectrical impedance send harmless currents through the body—results fluctuate with hydration levels and recent activity.
| Method | Accuracy | Accessibility |
|---|---|---|
| Water Displacement | ±1.5% | Research Labs |
| DEXA Scan | ±2% | Medical Facilities |
| Bioelectrical Impedance | ±5-8% | Consumer Devices |
Advanced options like X-ray analysis (DEXA) provide detailed breakdowns of fat distribution. However, limited availability and higher costs restrict widespread use. Studies show these tools better predict risk factors for heart disease in adults over 50 compared to basic calculations.
Age and gender significantly impact results. Women naturally carry more essential fat, while muscle loss in older adults skews readings. For accurate comparisons, experts recommend using the same measurement technique over years rather than mixing methods.
While modern tools paint a clearer picture than outdated systems, no single approach works perfectly. Combining multiple sources of data—like waist measurements with impedance tests—often yields the most actionable insights.
Conclusion
Understanding physical wellness requires more than a single metric. While traditional height-weight calculations offer quick insights, body composition analysis reveals what simple numbers miss. We’ve explored how muscle-to-fat ratios impact metabolic risks—even when scale results appear normal.
Modern tools like bioelectrical impedance devices provide accessible data, though accuracy varies. Research confirms that 1 in 3 adults with average weight classifications still carry dangerous fat levels around organs. This “hidden obesity” underscores why combining measurements matters for true health status evaluation.
Periodic monitoring helps track changes in lean mass versus fat stores. The American Council on Exercise recommends pairing waist measurements with advanced scans for high-risk individuals. Always consult healthcare providers to interpret results within your unique context.
No single test defines individual health. By blending population-level data with personal metrics, we create strategies that address both visible and invisible risks. Start your journey with trusted resources and professional guidance to make informed decisions about your wellness.

