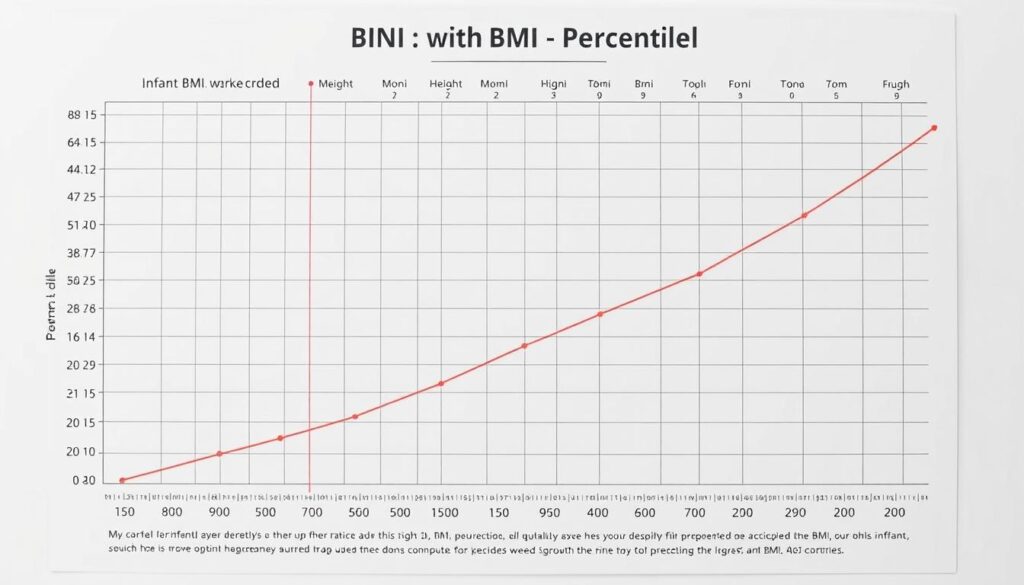
Parents often wonder: how do I know if my child is developing healthily? Tracking weight and height offers clues, but combining these measurements provides a clearer picture. That’s where tools like our BMI percentile calculator come into play. Unlike adult assessments, infant growth analysis requires age-specific standards from organizations like the CDC and WHO.
We designed this guide to simplify monitoring. By comparing body mass to length, caregivers gain insights into whether a child’s development aligns with national averages. Our step-by-step approach ensures accuracy, whether you’re converting pounds to kilograms or inches to meters.
Why does this matter? Early detection of growth patterns helps address potential concerns. Trusted sources emphasize that consistent tracking—paired with professional guidance—supports long-term health. Let’s explore how to interpret results and use them effectively.
Key Takeaways
- Infant growth analysis relies on age-adjusted metrics, not adult standards.
- Combining weight and height measurements offers a holistic view of development.
- Our tool aligns with CDC and WHO guidelines for reliability.
- Percentile rankings help contextualize results within broader population data.
- Regular tracking simplifies early detection of potential health trends.
Introduction to Infant BMI and Its Importance
Tracking a child’s development involves more than just milestones like first steps or words. Growth patterns—measured through weight, length, and age—reveal critical insights. Unlike adult assessments, pediatric measurements account for rapid physical changes during the first years.

What Growth Metrics Measure
Pediatricians use a simple formula: weight (kg) divided by height (m²). This calculation accounts for body mass relative to size. For example, a 12-month-old girl weighing 9.5 kg and measuring 74 cm would have different needs than a boy of the same age at 10.2 kg and 76 cm.
“Growth charts aren’t about perfection—they’re tools to spot trends,” notes Dr. Emily Carter, a pediatric nutrition specialist.
Why Regular Tracking Matters
Monitoring these metrics helps identify if a child’s progress aligns with peers. The table below shows typical percentile ranges for children aged 0-2 years:
| Age | Girls (5th-95th %) | Boys (5th-95th %) |
|---|---|---|
| 6 months | 14.1-18.3 | 14.9-18.7 |
| 12 months | 15.2-19.8 | 15.8-20.1 |
| 18 months | 15.8-20.5 | 16.3-21.0 |
Consistent checks allow caregivers to address concerns early. For instance, a result below the 5th percentile might suggest nutritional adjustments, while above the 95th could indicate overfeeding habits. Always pair these numbers with professional guidance.
Using the BMI Calculator for Infants
Navigating infant health metrics requires clear, actionable steps. Our tool simplifies this process by translating measurements into meaningful insights. Let’s break down how to use it effectively.

Step-by-Step Guide to Inputting Measurements
Start by selecting your preferred unit system. Choose between US customary (pounds/inches) or metric (kilograms/centimeters). Enter your child’s age in months and gender – this ensures age-specific comparisons for boys and girls.
| Measurement | US Units | Metric Units |
|---|---|---|
| Weight | Pounds | Kilograms |
| Height | Inches | Centimeters |
Double-check entries against recent doctor visits. A common error like entering 15 lbs instead of 15.3 lbs shifts results by 2-3 percentiles. Always use a flat surface for length measurements.
Converting Weight and Height into BMI
The formula weight ÷ (height × height) calculates the final value automatically. For example:
- 18 lbs (8.16 kg) and 28 inches (71 cm) becomes 8.16 ÷ (0.71 × 0.71) = 16.2
- This number then gets plotted against growth charts
Results update instantly, showing where your child falls within national averages. While our tool handles conversions, manual checks prevent device rounding errors. Pair these insights with pediatrician reviews for full context.
Interpreting BMI Results and Growth Charts
Understanding growth patterns requires more than numbers—it demands context. Percentile rankings transform raw measurements into actionable insights. Here’s how to navigate these tools effectively.
Breaking Down Percentile Categories
Growth charts categorize results into four ranges:
- Underweight: Below 5th percentile
- Healthy range: 5th to 85th percentile
- Overweight: 85th to 95th percentile
- Severe obesity: 95th percentile or higher
For example, a 9-month-old boy in the 30th percentile weighs more than 30% of peers but less than 70%. CDC data shows girls often trend 2-3% lower than boys in the first year.
Using Charts for Developmental Insights
Compare measurements against standardized curves. A sudden drop from the 60th to 20th percentile over three months could signal feeding issues. Steady progress within the same channel typically indicates healthy development.
“Percentiles are roadmaps, not verdicts. Look for consistency, not perfection,” advises pediatrician Dr. Lisa Nguyen.
| Age | Healthy Range (Boys) | Healthy Range (Girls) |
|---|---|---|
| 6 months | 14-18% | 13-17% |
| 12 months | 15-19% | 14-18% |
Recognizing When to Seek Guidance
Consult a provider if:
- Results cross two percentile channels (e.g., 50th to 10th)
- Persistent values below 5th or above 95th
- Plateaus lasting 2+ checkups
Balanced nutrition and age-appropriate physical activity support stable growth. Track trends over time—single measurements rarely tell the full story.
Conclusion
Every parent wants the best start for their child’s physical well-being. Our guide simplifies tracking weight, length, and age using reliable tools aligned with CDC and WHO standards. By focusing on accurate measurements, caregivers gain clear insights into growth patterns through percentile rankings.
Consistent monitoring helps identify trends early. Compare boys and girls separately on standardized charts, as their developmental paths often differ. Remember: single results matter less than steady progress over time.
Pair these insights with balanced nutrition and age-appropriate physical activity. While our tool offers trusted information, always consult a pediatrician if percentiles shift dramatically. Small adjustments today can support lifelong health.
Ready to take action? Use our resource to track progress monthly. Revisit the data every 3-6 months to ensure your child stays on a thriving path. Knowledge empowers—start building healthier habits now.


