What if tracking your newborn’s growth was as simple as entering two numbers? While parents often rely on pediatric checkups, understanding body mass index (BMI) offers a clearer window into a child’s development. Our guide introduces a tool designed to simplify this process—without replacing expert medical advice.
Body mass index is calculated using weight (in kilograms) and height (in meters). For infants, these measurements are plotted against pediatric growth charts to determine percentiles. These percentiles compare your child’s growth to others of the same age and gender, offering insights into trends over time.
Our interactive resource uses formulas aligned with global health standards, similar to those from the World Health Organization. It focuses on weight-height ratios and percentile rankings, helping you spot patterns early. While not a diagnostic tool, it empowers caregivers with data to discuss with doctors.
Key Takeaways
- Body mass index for infants combines weight and height to assess growth patterns.
- Percentiles compare your child’s development to standardized population data.
- Measurements should use precise SI units (kg and meters) for accuracy.
- Growth trends matter more than single data points over time.
- Always pair digital tools with professional pediatric evaluations.
Understanding BMI for Newborns
Parents can gauge their baby’s health through careful measurement practices. Accurate tracking relies on standardized methods and clear benchmarks to assess development.
How We Measure Weight and Height
Precision matters when recording your child’s weight and height. Use digital scales for weight (in kilograms) and a flat surface with a measuring tape for length (in meters). Convert pounds to kilograms by dividing by 2.2 if using customary units.

The standard formula divides weight by height squared to calculate body mass index. For example, a 6 kg infant measuring 0.65 meters has a mass index of 14.2 kg/m².
What This Metric Means for Health
Percentiles reveal how your baby’s growth compares to peers. A 60th percentile means 40% of children the same age and gender weigh more. Key factors include:
- Trends over time: Consistent growth curves matter more than single measurements.
- Age adjustments: Development phases influence healthy weight ranges.
- Risk indicators: Percentiles below 5 or above 95 may signal undernutrition or obesity.
Global health organizations like the CDC use these benchmarks to identify potential issues early. Pairing this data-driven approach with pediatric checkups ensures a complete picture of your child’s well-being.
Using Our BMI Calculator for Newborns
Our online tool transforms how you monitor your infant’s growth metrics. Designed for simplicity, it guides caregivers through a three-step process while aligning with clinical standards. This ensures reliable insights without overwhelming users.
Interactive Features and Step-by-Step Process
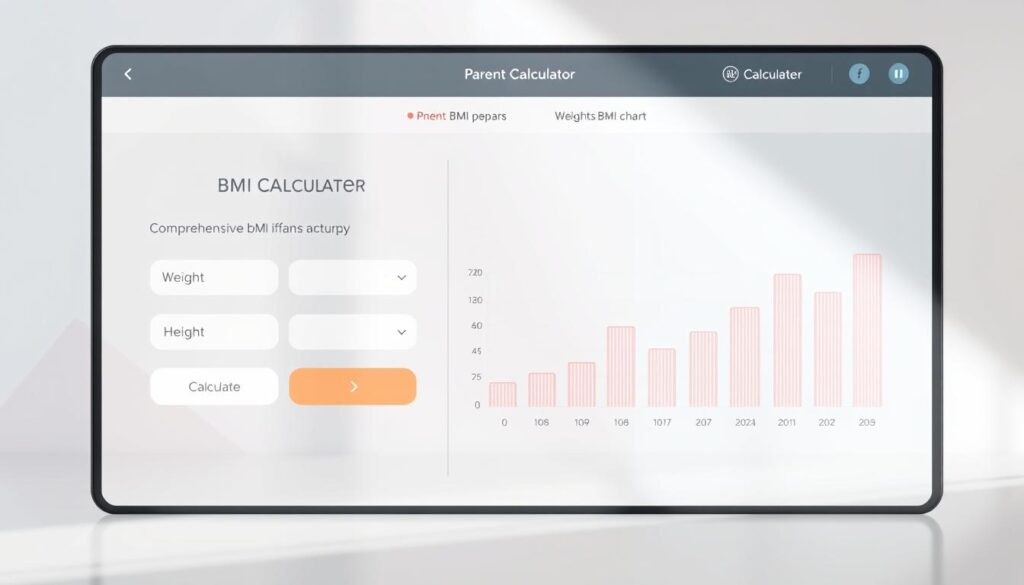
First, enter your child’s weight and height using either kilograms/meters or pounds/feet. The tool automatically converts units to prevent errors. Next, input their age in months—a critical factor for accurate percentile comparisons.

After clicking “Calculate,” you’ll see two results: a numeric value and a growth percentile. These metrics help identify patterns when tracked over time. For instance, consistent 75th-percentile rankings suggest steady development relative to peers.
| Aspect | Manual Calculation | Our Tool |
|---|---|---|
| Units Supported | Single system only | SI & Customary |
| Speed | 5+ minutes | Instant |
| Growth Tracking | Manual charts | Auto-saved history |
We’ve integrated features from trusted resources like pediatric growth tracking strategies to enhance reliability. The interface also explains how body mass relates to height squared—no math required. For ongoing health management, pair this data with effective body composition improvements recommended by experts.
Regular updates let you spot deviations early. Always share trends—not single numbers—with your pediatrician for meaningful discussions.
Interpreting BMI Results and Health Implications
Understanding your baby’s growth numbers can feel like decoding a secret language. Percentiles act as a compass, showing where your child stands compared to peers of the same age and gender. Trends over weeks or months often matter more than a single measurement.
What Percentiles Reveal
A 50th percentile means half of children weigh more, and half weigh less. Consistent placement between the 15th and 85th percentiles typically aligns with healthy development. Sudden jumps or drops—like moving from the 30th to 70th percentile in weeks—warrant attention.
Pediatricians use standardized charts from groups like the CDC to identify patterns. For example, staying below the 5th percentile could signal undernutrition, while exceeding the 95th might indicate early obesity risks. These thresholds help flag when professional guidance becomes essential.
Recognizing Critical Signals
Three scenarios suggest consulting a doctor:
- Multiple measurements below the 5th or above the 95th percentile
- Unusual plateaus in growth curves over three checkups
- Significant mismatch between weight and height trends
Other factors like feeding patterns, energy levels, and physical activity shape overall health. A child in the 10th percentile who’s active and meeting milestones may not need intervention. Always pair data with observations of their behavior and development.
Track changes using tools that auto-save historical results. Share these trends during pediatric visits—context helps doctors spot issues manual calculations might miss.
Conclusion
Tracking your child’s development becomes simpler with tools designed for precision. Our BMI calculator for newborns offers caregivers a clear snapshot of growth trends using weight and height data. Accurate inputs ensure reliable results—always measure in kilograms and meters for consistency.
Understanding percentile rankings helps identify patterns early. A child’s position on growth charts reveals how they compare to peers, aiding in maintaining a healthy weight trajectory. Regular monitoring catches shifts that single measurements might miss.
While this resource provides valuable health insights, it works best alongside pediatric expertise. Share trends—not just numbers—with your doctor if results fall outside typical ranges. Consistent checkups add context to digital data.
Ready to start? Use our trusted tool today and revisit this guide as your infant grows. Knowledge empowers better decisions, and proactive tracking supports lifelong well-being.


