What if the way we measure health for young people misses half the story? Many families rely on basic weight charts, but growth patterns and body composition change rapidly during adolescence. That’s why experts use specialized tools to assess what’s truly happening beneath the surface.
We’ve designed this guide to help you navigate a critical metric: the body mass index. Unlike adult measurements, this calculation accounts for age, sex, and developmental stages. It’s not about labels—it’s about understanding how weight relates to height in growing bodies.
Health organizations like the CDC and NHS emphasize using age-specific percentiles rather than generic numbers. Our tool generates precise results for ages 2 through 19, showing where a child falls compared to national averages. You’ll get three clear data points: the index value, its percentile ranking, and a health category.
This isn’t just math—it’s a roadmap. By the end of this guide, you’ll know how to interpret results confidently and use them to support your teen’s well-being. Let’s turn confusing numbers into meaningful insights together.
Key Takeaways
- Specialized assessments account for growth spurts and puberty-related changes
- Results include percentile rankings based on age and biological sex
- Trusted health organizations endorse this method for ages 2-19
- Three-part analysis provides clearer health insights than basic weight checks
- Proper interpretation helps identify potential concerns early
Understanding BMI and Its Importance for Teens
Adolescence brings rapid physical changes that standard health metrics might overlook. Unlike adults, growing bodies require tools that factor in developmental stages and hormonal shifts. This is where body mass index becomes valuable—it’s a starting point for evaluating how weight and height interact during critical growth years.

Defining Body Mass Index and Its Role in Teen Health
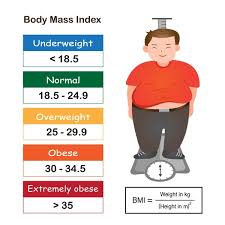
The index compares weight to height squared, but age and biological sex adjust the results. For example, a 14-year-old athlete might show a higher value than peers due to muscle mass, not fat. Health professionals use sex-specific growth charts to account for these variables, ensuring fair comparisons across populations.
Interpreting BMI Percentiles in Growing Children
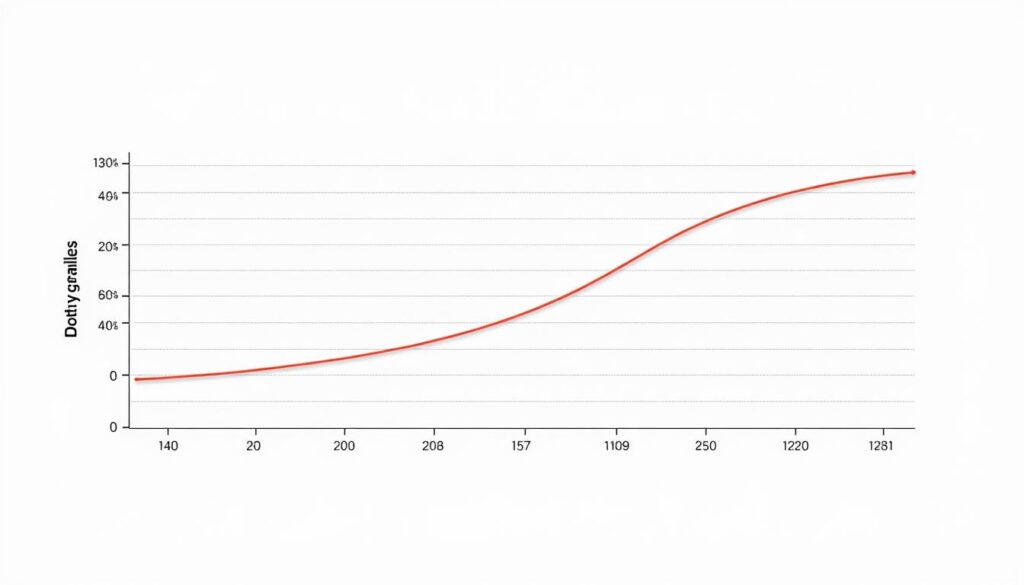
Percentiles reveal where a child’s measurement lands compared to others their age. A 75th percentile means 75% of peers have lower values. However, trends matter more than single numbers. Doctors track these rankings over time to spot sudden jumps or drops linked to diet, activity levels, or medical conditions.
Three factors refine the analysis:
- Consistent growth patterns over 6-12 months
- Family history of body composition traits
- Physical abilities and energy levels
Combining these elements creates a fuller picture than numbers alone. While no tool is perfect, this approach helps families and caregivers make informed choices about nutrition and lifestyle habits.
BMI calculator for teens: How It Works in Practice
Accurate health assessments begin with precise measurements. Our tool simplifies the process while maintaining scientific rigor, transforming raw data into actionable insights for families.

Step-by-Step Guide to Using the Calculator
Start by gathering three critical details: birth date, current weight, and exact height. Use a digital scale on hard flooring and measure stature without shoes. For accuracy, the CDC recommends taking measurements at consistent times—morning readings often provide the most stable results.
Enter the numbers into our system, double-checking decimals and units. The algorithm automatically adjusts for age and biological sex, crucial factors during puberty. Within seconds, you’ll receive three key outputs:
- A numerical value comparing mass to stature
- Percentile ranking against national data
- Health category based on established thresholds
Understanding Results: BMI, Percentile, and Categories
Focus on trends rather than single numbers. A 60th percentile means 60% of peers have lower values. However, rapid shifts—like moving from the 40th to 80th percentile in six months—warrant discussion with healthcare providers.
Our growth charts visualize progress over time, helping identify patterns. Remember:
- Muscle development affects results differently than fat
- Seasonal weight fluctuations are normal
- Genetic predispositions influence body composition
Use these insights to guide conversations about nutrition and activity, not as definitive labels. Regular check-ins create opportunities for positive habit-building during critical growth phases.
Factors Influencing BMI in Children and Teens
Youth bodies aren’t static—they’re constantly reshaping themselves. Growth patterns vary widely during adolescence, with some gaining height rapidly while others develop muscle mass. These natural changes make weight-height ratios more complex to interpret than simple adult measurements.
Growth Spurts and Biological Differences
Hormonal shifts during puberty create distinct gender-based patterns in body composition. Boys often gain more lean mass, while girls typically develop higher fat percentages. These differences explain why healthcare professionals use separate growth charts for each biological sex.
| Factor | Male Development | Female Development |
|---|---|---|
| Growth Spurts | Peak at 13-15 years | Peak at 11-13 years |
| Body Composition | +22% muscle mass | +11% body fat |
| Hormonal Influence | Testosterone-driven | Estrogen-driven |
Three key elements affect measurement accuracy:
- Timing of growth spurts relative to peers
- Family history of body type characteristics
- Recent changes in physical activity levels
Healthcare providers analyze these risk factors alongside index values. For example, a sudden 20% percentile jump might signal excessive calorie intake rather than healthy development. Regular check-ups help distinguish normal changes from potential obesity concerns.
Nutritionists emphasize tracking child weight trends alongside height gains. A 12-year-old growing 4 inches while maintaining weight might show a lower index value despite healthy development. Always pair numbers with real-world observations—energy levels, sleep quality, and emotional well-being.
Conclusion
Growing bodies tell stories numbers can’t capture alone. Our tool helps families track physical development while acknowledging natural variations in mass and body composition. It’s designed to complement—not replace—ongoing conversations with healthcare providers.
Results reflect factors like activity levels, body fat distribution, and genetic tendencies. Girls and boys often follow distinct growth paths, which age-adjusted charts account for. Regular check-ins allow caregivers to spot trends rather than fixate on single measurements.
Use this data alongside professional advice to shape decisions about nutrition or exercise. For those exploring healthy changes, our guide to effective body composition strategies offers science-backed steps. Remember: no chart captures a person’s full potential or challenges.
We encourage families to view these insights as one piece of a larger puzzle. Pair them with observations about energy, sleep, and emotional well-being. Together, they create a roadmap for supporting young people through transformative years.


