What if the number on your scale doesn’t tell the whole story about your health? While weight matters, it’s just one piece of a larger puzzle. Understanding your body composition—like fat versus muscle—plays a far bigger role in assessing wellness. That’s where tools like body mass index come into play.
We’ve designed a resource tailored to address women’s unique physiological needs. Unlike generic tools, ours accounts for factors like hormonal fluctuations and natural variations in fat distribution. Simply input your height (in inches or centimeters) and weight (in pounds or kilograms), and you’ll receive instant insights into your current status.
A healthy range typically falls between 18.5 and 25 kg/m². Values below or above this spectrum may indicate underweight or overweight conditions. However, this metric works best when combined with other assessments—like waist circumference or body fat percentage—to paint a complete picture.
Key Takeaways
- Tailored for female physiology, addressing hormonal and body composition differences
- Supports both metric and US measurements for global accessibility
- Healthy range (18.5–25 kg/m²) helps identify potential health risks
- Integrates with BMI Prime and Ponderal Index for advanced analysis
- Provides actionable insights alongside basic calculations
Our tool goes beyond basic math—it’s built to help you make informed decisions. Whether you’re tracking progress or assessing risks for conditions like diabetes, clarity starts here. Ready to see where you stand?
Understanding the Importance of BMI in Women’s Health
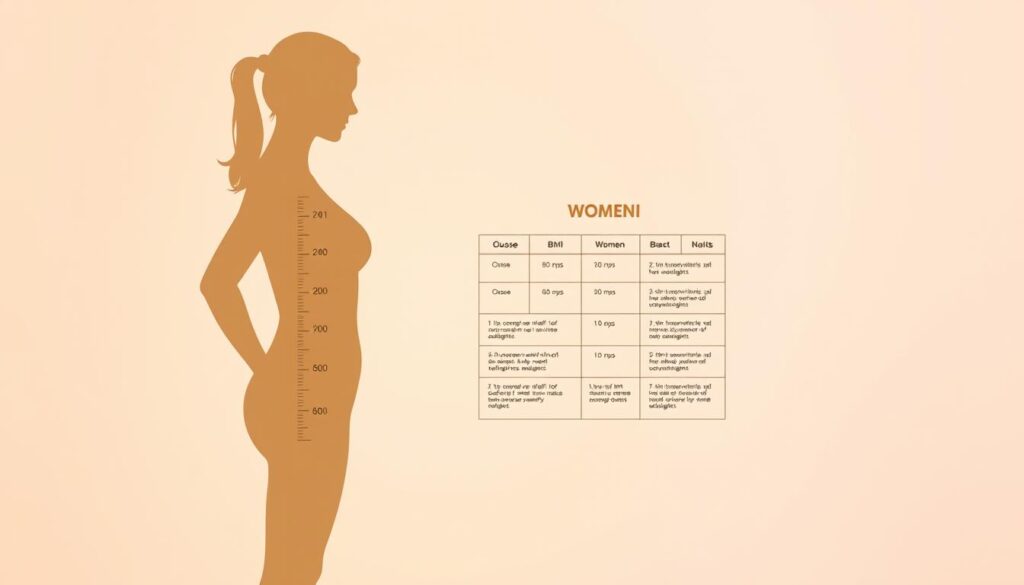
Health metrics often reveal what mirrors can’t show. The World Health Organization and CDC recognize body mass index as a universal screening method for evaluating potential health concerns. This measurement categorizes adults into four groups: underweight (below 18.5), normal (18.5–24.9), overweight (25–29.9), and obese (30+).

Why This Number Matters
Research shows a direct correlation between elevated index values and conditions like heart disease or type 2 diabetes. For every 5-unit increase above 25 kg/m², cardiovascular risks rise by 29%, according to NIH studies. These insights make regular monitoring crucial for early intervention.
Beyond Basic Numbers
While the index doesn’t differentiate between muscle and fat, it serves as a starting point for deeper analysis. Medical professionals often pair it with waist measurements or blood tests to assess metabolic health. Our body composition strategies complement these evaluations, offering tailored pathways to improvement.
Percentile rankings add context for younger populations. Girls in the 85th–94th percentiles face higher obesity-related risks later in life. By understanding where you stand today, proactive steps become possible—transforming data into lasting wellness.
How Our BMI Calculator for Women Works
Understanding your body starts with accurate inputs. Our tool simplifies health assessments by translating basic metrics into meaningful insights. Designed for all ages between 18–80, it adapts to your preferred measurement system while accounting for biological factors unique to female physiology.

Inputting Your Metrics for Accurate Results
Begin by entering three details: height, weight, and age. Choose between inches/pounds or centimeters/kilograms—the system auto-converts units instantly. For example, typing “64 inches” becomes 162.5 cm, while “140 pounds” translates to 63.5 kg. Age adjustments ensure hormonal changes and metabolic shifts are considered.
Instant Calculation and Clear Interpretations
Within seconds, you’ll see your primary score alongside advanced metrics like BMI Prime (ratio to healthy threshold) and Ponderal Index (mass distribution analysis). Results appear in color-coded categories:
| Range (kg/m²) | Category | Health Implications |
|---|---|---|
| <18.5 | Underweight | Nutritional deficiencies |
| 18.5–24.9 | Normal | Lowest disease risk |
| 25–29.9 | Overweight | Moderate diabetes risk |
| ≥30 | Obese | Elevated heart issues |
Each result includes practical tips tailored to your profile. Compare your numbers with standard body mass index charts or explore strategies for improving body composition. Our interface prioritizes clarity—no medical jargon, just actionable guidance.
Factors Influencing BMI for Women
Numbers rarely tell the full story—especially when evaluating physical wellness through a single metric. Biological diversity and life stages create unique patterns in how bodies store energy and build tissue. Let’s explore why identical index values might mean different things for different individuals.

Age and Hormonal Considerations
Metabolism naturally slows by 2-4% per decade after age 30, according to research on hormonal shifts. Menopause amplifies this effect, often redistributing fat to the abdominal area. These changes can elevate index values without reflecting true health risks—a critical nuance our tool accounts for in its analysis.
Body Composition and Measurement Nuances
Muscle weighs more than fat, which explains why athletes might show higher scores despite low body fat. Waist circumference measurements add clarity, with values over 35 inches signaling increased cardiovascular risks. We recommend pairing your results with weight-to-height ratios for a balanced perspective.
BMI Charts and Percentile Analysis
Population-based charts reveal where you stand compared to others in your age and gender group. A 45-year-old woman at the 70th percentile faces different considerations than someone at the 30th. Our system cross-references multiple data sets, helping you interpret numbers through a personalized lens.
While useful, this metric works best alongside tools like skinfold measurements or bioelectrical impedance analysis. Every body tells a richer story than any single calculation can capture—a truth we honor in every assessment we provide.
Enhancing Women’s Health Through Accurate BMI Measurement
True wellness insights emerge when numbers meet context. While body mass index offers a foundational snapshot, combining it with other metrics transforms data into actionable health strategies.
Building a Complete Health Profile
Our tool pairs standard calculations with three critical additions:
- Waist measurements identifying abdominal fat risks (over 35 inches increases heart disease likelihood)
- Body composition analysis distinguishing muscle from fat stores
- BMI Prime comparing your score to the 25 kg/m² threshold
The CDC reports adults with elevated index values and large waist sizes face double the diabetes risk of those with only high mass index scores. This synergy explains why our system cross-references multiple datasets.
Consider two women with identical 27 kg/m² scores:
| Factor | Case A | Case B |
|---|---|---|
| Waist Size | 32″ | 38″ |
| Muscle Mass | High | Low |
| Recommended Action | Maintenance | Lifestyle Changes |
This contrast shows why singular metrics can mislead. The American Cancer Society notes abdominal fat specifically correlates with 12 cancer types, making waist tracking essential for women.
By integrating these elements, our approach delivers personalized guidance rather than generic advice. As we’ll explore in the conclusion, understanding your unique profile through our comprehensive tool helps bridge the gap between numbers and lasting well-being.
Conclusion
Navigating health metrics requires tools that understand biological diversity. Our body mass index assessment considers factors like age-related metabolic shifts and fat distribution patterns unique to female physiology. Public health leaders at the CDC and WHO emphasize pairing this metric with waist measurements—a practice we’ve integrated into every analysis.
Maintaining scores between 18.5–25 kg/m² reduces cardiovascular and diabetes risks by up to 29%, according to national studies. Yet numbers alone don’t define wellness—muscle mass ratios and abdominal fat percentages provide critical context. This layered approach helps distinguish between healthy athletes and those needing lifestyle adjustments.
We’ve built more than a calculation tool—it’s a gateway to personalized health strategies. Track changes over time using our auto-save feature, and compare results against updated medical guidelines. Explore complementary resources on nutrition planning and body composition optimization to create sustainable habits.
Your journey toward informed health decisions starts with understanding what these numbers truly mean—and we’re here to illuminate every step.


