
What if the way you measure your health is missing half the story? For decades, people have relied on simple calculations to gauge well-being. But how accurate are these methods—and what do they truly reveal about your body?
We designed our service to simplify health insights using globally recognized standards. By entering kilograms and meters, you receive instant results aligned with World Health Organization guidelines. Our system automatically converts inputs to generate a precise figure that reflects your current status.
For example, a result of 23 kg/m² falls within the optimal range for most adults. This tool works for anyone aged 2 to 120, offering clarity without complex formulas. It’s more than math—it’s a starting point for informed decisions about nutrition, fitness, and lifestyle.
Key Takeaways
- Instant metric-based analysis using kilograms and meters
- Aligns with WHO standards for global consistency
- Clear categorization of results into health ranges
- No manual conversions or advanced math required
- Suitable for all ages from toddlers to seniors
Our BMI calculator metric units service removes guesswork through automated processing. Whether you’re tracking progress or setting new goals, this resource provides reliable data in seconds. See how numbers translate to actionable health insights—without jargon or confusion.
Understanding Body Mass Index with Metric Measurements
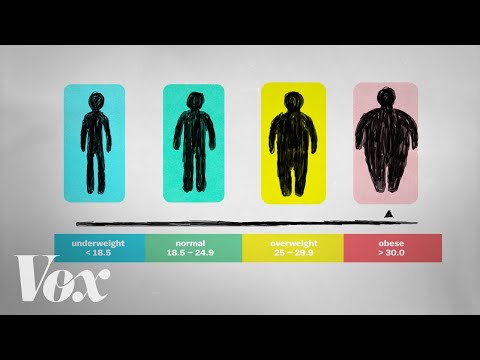
Accurate health evaluation starts with understanding key indicators recognized worldwide. Body mass index combines height and weight measurements to assess potential health risks. Organizations like WHO and CDC use it to classify underweight, healthy, and overweight ranges.
Definition and Importance
The formula divides a person’s weight in kilograms by their height in meters squared. This creates a standardized number that helps identify trends across populations. For adults, values between 18.5 and 24.9 typically indicate healthy ranges.

Measurement Precision Matters
Metric units eliminate conversion errors that occur with pounds and inches. Using kilograms and meters ensures consistent results whether you’re in Tokyo or Toronto. Children’s charts differ because they account for growth patterns and age-specific norms.
| Category | WHO Range (kg/m²) | CDC Range (kg/m²) |
|---|---|---|
| Underweight | < 18.5 | < 18.5 |
| Healthy | 18.5–24.9 | 18.5–24.9 |
| Overweight | 25–29.9 | 25–29.9 |
While not perfect, this measurement helps spot potential issues like heart strain or nutritional gaps. Our body composition analysis tool applies these global standards to give clear, actionable insights.
BMI calculator metric units: How Our Tool Works
Modern health tools should empower rather than confuse. Our system transforms complex math into clear insights through intelligent design. Three core elements make it effective: simplicity, accuracy, and actionable results.

User-Friendly Interface Features
We built this resource for instant understanding. Input fields accept both centimeters/meters and pounds/feet—the tool handles conversions silently. Real-time alerts flag typos or unrealistic entries before processing.
Step-by-Step Calculation Process
Here’s what happens when you click “Calculate”:
- Data conversion: Imperial measurements transform to kilograms and meters
- Height adjustment: Centimeters become meters (180 cm → 1.8 m)
- Formula application: Weight ÷ (Height × Height) = Final figure
| Measurement | SI Units | US Units | Example Conversion |
|---|---|---|---|
| Weight | Kilograms | Pounds | 160 lbs → 72.6 kg |
| Height | Meters | Feet/Inches | 5’10” → 1.78 m |
A 72.6 kg person at 1.78 m height gets 22.9 kg/m²—within the optimal range. We also compute the Ponderal Index to account for body proportions, offering deeper insights than basic assessments.
Interpreting BMI Results and Health Indicators
Numbers tell stories, but only if you know how to read them. Your measurement becomes meaningful when paired with context about age, activity levels, and biological factors. Let’s explore what different ranges signify and how to use this information responsibly.

Understanding Range Classifications
Health organizations classify results into four main groups. The World Health Organization and CDC agree on these thresholds for adults:
| Classification | Range (kg/m²) | Associated Risks |
|---|---|---|
| Below Optimal | < 18.5 | Nutritional deficiencies, weakened immunity |
| Healthy Zone | 18.5–24.9 | Lowest risk for chronic conditions |
| Elevated | 25–29.9 | Increased chance of diabetes, heart issues |
| High Risk | ≥ 30 | Severe cardiovascular strain, joint problems |
Athletes might show higher numbers due to muscle mass, while older adults could have lower figures from natural muscle loss. Children use growth charts comparing their position relative to peers.
Beyond Basic Measurements
Two advanced metrics provide deeper insights:
- BMI Prime: Your result divided by 25 (the healthy threshold). A value of 1.2 means you’re 20% above the standard healthy limit
- Ponderal Index: Uses height cubed instead of squared, better for very tall or short individuals
“No single number defines health, but patterns help identify areas needing attention.”
Discuss your findings with a doctor, especially if you have high body fat or family history of heart disease. Our BMI calculator metric units tool simplifies initial assessments—use it as a conversation starter, not a final verdict.
Practical Tips for Achieving a Healthy BMI
Small, consistent changes often create the biggest impact on well-being. Whether you’re aiming to maintain or adjust your current status, combining smart habits with professional guidance yields sustainable results.
Lifestyle and Nutritional Guidance
Balanced eating and regular movement form the foundation of lasting health. Focus on whole foods like vegetables, lean proteins, and whole grains. Swap sugary drinks for water or herbal teas—simple swaps reduce empty calories without drastic changes.
Adults should aim for 150 minutes of moderate exercise weekly. Walking, cycling, or dancing keeps your heart strong and supports healthy weight management. Track progress using reliable tools like the CDC’s healthy weight guidelines to stay aligned with medical standards.
| Goal | Nutrition Focus | Activity Targets |
|---|---|---|
| Weight Loss | Reduce processed foods | Add 2 strength sessions weekly |
| Muscle Gain | Increase protein intake | Focus on resistance training |
| Maintenance | Portion control | Mix cardio and flexibility exercises |
Consulting with Healthcare Professionals
Sudden shifts in body mass or extreme results warrant expert input. Nutritionists tailor meal plans to your needs, while trainers design safe workouts. Those with diabetes or heart disease history benefit from personalized strategies.
Parents should monitor children’s growth patterns using age-adjusted charts. For women over 40, hormonal changes may require adjusted calorie goals. Remember: sustainable change takes time—aim for 1-2 pounds weekly instead of rapid drops.
Our BMI calculator metric units tool helps track progress, but it’s just one piece of your health puzzle. Pair insights with professional advice to build habits that last.
Conclusion
Understanding your body’s needs starts with reliable measurements. Our BMI calculator metric units simplifies health tracking using weight and height—values between 18.5 and 24.9 kg/m² signal optimal ranges for most adults. This instant assessment helps identify potential risks like heart disease or diabetes early.
Results become powerful when paired with action. Those outside healthy zones gain clarity to adjust nutrition or activity levels. Parents can monitor children’s growth patterns, while older adults track age-related changes. Remember: muscle mass and bone density affect readings—consult professionals for personalized advice.
Take control today. Use our tool to spot trends, then discuss findings with your doctor. Whether maintaining wellness or addressing concerns, knowledge fuels better choices. Start your journey toward lasting health—one informed step at a time.