What if the number on your scale doesn’t tell the full story about your health? For decades, professionals have relied on a simple formula to assess body composition—but does it truly reflect your well-being? Let’s unpack the basics of the body mass index and why it remains a cornerstone of health evaluations.
The body mass index calculates body fat using weight and height. While it’s not a direct measurement, it helps identify potential risks linked to being underweight, overweight, or experiencing obesity. This screening tool offers a starting point for deeper conversations about health.
Clinicians use mass index ranges to categorize adults into groups: underweight, healthy weight, overweight, and obesity. These labels guide personalized advice but don’t account for muscle mass, bone density, or genetic factors. That’s why it’s paired with blood tests, lifestyle reviews, and other assessments.
In this article, we’ll clarify how these classifications work and their role in modern healthcare. You’ll learn why they matter—and where their limitations lie.
Key Takeaways
- The body mass index estimates body fat using weight and height ratios.
- It categorizes adults into four main groups, including obesity subclasses.
- BMI is a screening tool, not a standalone health diagnosis.
- Other factors like muscle mass and genetics influence individual results.
- Healthcare providers combine it with additional tests for accurate assessments.
Understanding BMI: Calculation, Uses, and Limitations
How much does a simple math equation reveal about your health? The body mass index uses weight and height to estimate body composition. Its formula—weight in kilograms divided by height in meters squared—provides a quick snapshot of potential health risks.

How We Calculate BMI and What It Measures
For a person weighing 70 kg (154 lbs) and standing 1.75 meters (5’9″), the calculation would be 70 ÷ (1.75 x 1.75) = 22.9. This number correlates with body fat percentages in most adults. While it doesn’t directly measure fat, studies show higher BMI values often align with increased risk for conditions like diabetes.
Healthcare providers rely on this tool because it’s fast, noninvasive, and works for large populations. Research confirms its effectiveness in initial health screenings. However, athletes with high muscle mass may score higher despite low body fat.
Exploring the Pros and Cons of BMI as a Screening Tool
The system’s simplicity allows anyone to check their status using online tools. It helps identify trends in healthy weight management across communities. Yet, it overlooks bone density, fat distribution, and genetic differences.
For individuals, combining BMI with blood pressure checks, waist measurements, and lifestyle reviews creates a clearer picture. This layered approach addresses the index’s blind spots while keeping its efficiency intact.
BMI categories explained: Definitions and Health Risk Implications
Health professionals use weight-to-height ratios to identify potential risks. Let’s explore how these groupings work and why they matter in preventive health care.

Breaking Down Weight Ranges
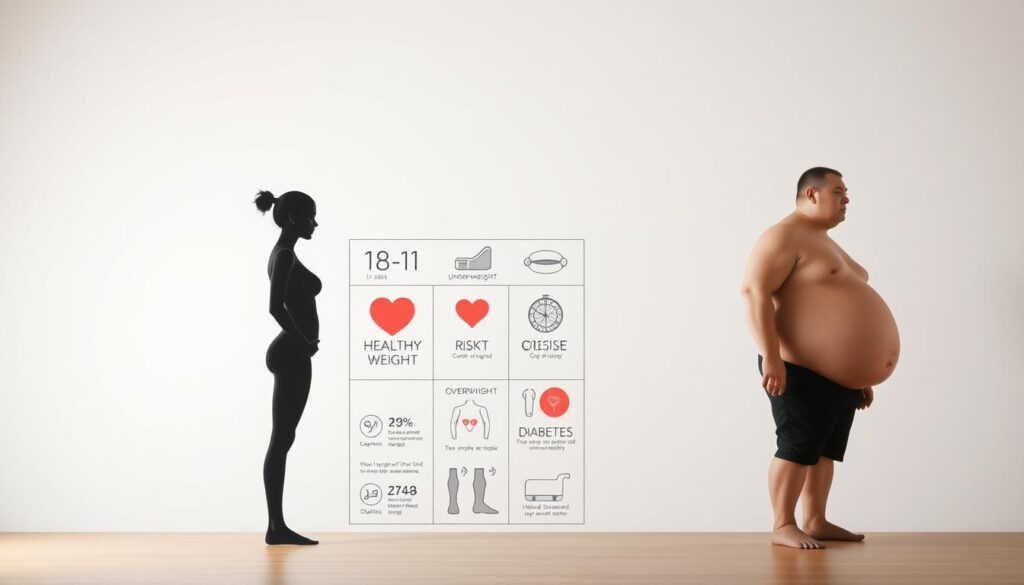
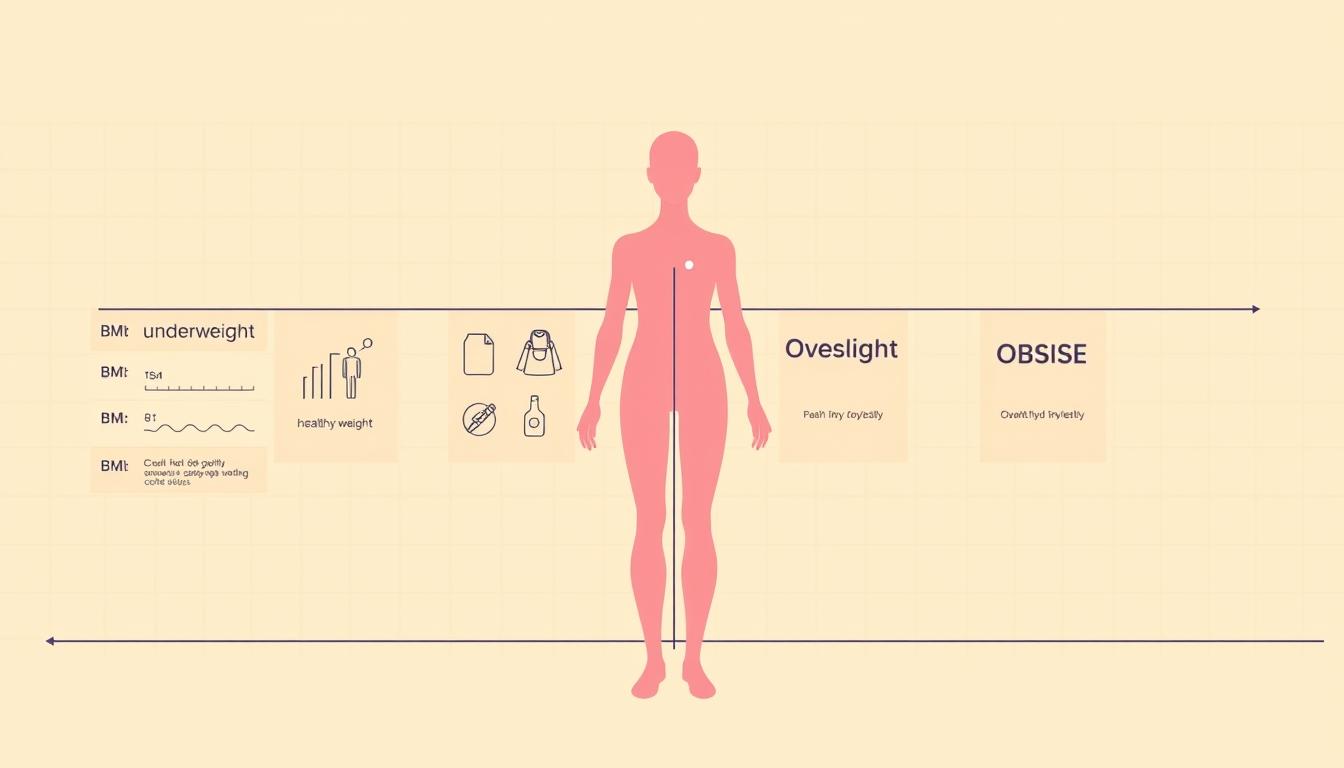
Adults fall into four main groups based on kilograms per square meter calculations:
| Classification | Range | Key Considerations |
|---|---|---|
| Underweight | Below 18.5 | Nutritional deficiencies, weakened immunity |
| Healthy | 18.5–24.9 | Lowest risk for weight-related disease |
| Overweight | 25–29.9 | Elevated blood pressure risks |
| Obesity | 30+ | Class I-III with increasing diabetes likelihood |
Connecting Dots Between Weight and Wellness
Those above 25 face higher chances of developing type 2 diabetes – studies show a 7x greater risk compared to healthy ranges. Body weight distribution matters too – abdominal fat raises cardiovascular concerns more than hip fat.
Age adjustments matter. Older adults often benefit from slightly higher ranges to maintain energy reserves. For children, growth charts replace fixed numbers, tracking percentiles over years.
While calculate bmi tools provide instant feedback, comprehensive assessments check cholesterol, blood sugar, and family history. This layered approach helps personalize prevention strategies.
Interpreting BMI in Individual and Population Health
Could a single number influence both your doctor’s advice and national health policies? The body mass index serves dual roles—guiding personal care choices while shaping large-scale wellness strategies. Let’s examine how this tool bridges individual health management and community interventions.
Personal Health Assessment and Care Decisions
During routine checkups, clinicians track weight changes using this metric alongside bloodwork and lifestyle reviews. For adults, results often determine referrals to nutritionists or fitness programs. One study found that 68% of primary care plans incorporate these scores when addressing activity levels or dietary habits.
However, providers account for factors like muscle development in athletes or bone density in older populations. A football player might show a high reading despite low body fat—a reminder that numbers alone don’t dictate health.
Community and Public Health Insights
On a broader scale, aggregated data reveals obesity trends across zip codes or income groups. Cities use these patterns to allocate resources—like adding parks in areas with low activity rates. National programs target adult populations with education campaigns when regional averages exceed 30.
Researchers also analyze how factors like food access or workplace environments impact weight. By mapping results against socioeconomic screening data, policymakers identify communities needing urgent support. This approach turns individual metrics into actionable public solutions.
Conclusion
Why does a simple formula remain central to health discussions worldwide? Understanding weight-to-height ratios balances practical screening with awareness of their limits. For adults, calculations using meters and kilograms provide quick insights, while children and teens require growth-focused percentile tracking to account for developmental changes.
Regular physical activity and nutrition adjustments help manage results, but numbers alone don’t define wellness. Athletes with higher muscle mass or older adults with bone density shifts may need tailored interpretations. For younger populations, consistent BMI percentile reviews ensure early detection of potential health risks.
Communities use aggregated data to shape parks, school programs, and healthcare access—proving its value beyond individual checkups. Yet pairing these metrics with blood tests, waist measurements, and lifestyle reviews remains critical.
Whether you’re tracking a child’s growth or evaluating personal habits, view this tool as one piece of a larger puzzle. Always consult professionals to contextualize your BMI measure alongside unique factors like genetics or fitness routines. Small steps in physical activity and mindful choices create lasting impacts—for both person weight management and overall vitality.

