
What if a single number could reveal critical insights about your health? While body mass index isn’t perfect, it remains one of the most widely used tools for evaluating weight-related risks. This guide helps you understand how height and weight measurements translate into actionable health data.
We’ve compiled the latest research from trusted institutions like the CDC and National Institutes of Health to create this comprehensive resource. Our analysis focuses on helping you interpret measurements within the context of your unique body composition and life stage.
While the standard calculation (weight in pounds divided by height in inches squared, multiplied by 703) provides a baseline, we emphasize pairing this data with other health markers. Explore our effective weight management strategies to create a complete picture of wellness.
Key Takeaways
- Body mass index calculations use simple height and weight measurements
- Results help identify potential health risks when used as screening tools
- Standard charts don’t account for muscle mass or bone density variations
- Combine with waist circumference and bloodwork for full assessment
- Regular monitoring helps track progress toward healthy weight goals
Understanding Body Mass Index and Its Context
Evaluating body composition starts with understanding key measurements. Health professionals use a numerical value calculated from weight and height to estimate fat levels. This screening tool helps identify potential risks linked to extreme values.

What This Number Reveals
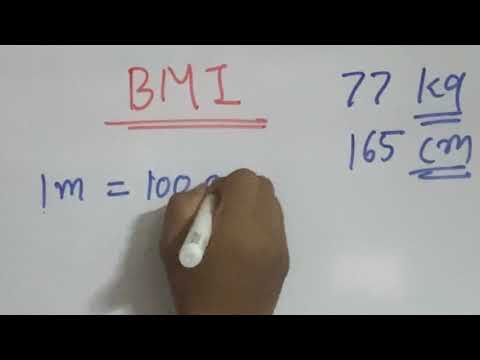
We calculate this figure using a simple formula: weight divided by height squared. While not a direct fat measurement, it serves as an initial check for obesity or underweight concerns. Clinics nationwide apply these standards from the Centers for Disease Control and Prevention during routine checkups.
Age and Biological Sex Differences
Youth evaluations differ significantly from adult assessments. Those under 20 years require growth charts tracking development through percentiles. Biological sex influences fat distribution patterns, making gender-specific analysis crucial for accurate interpretations.
When Numbers Don’t Tell the Whole Story
Muscle mass skews results for athletes, while bone density affects older adults. Population studies show varying risk thresholds across ethnic groups. “This tool works best alongside blood pressure readings and waist measurements,” notes recent Medical News Today research. Always pair screenings with personalized health history reviews.
BMI chart by age and gender
Health assessments require tailored approaches across different life stages. Standardized measurements gain meaning when paired with demographic insights, particularly biological sex and developmental phases. Our analysis uses data from the Centers for Disease Control and Prevention to clarify these variations.

Chart Breakdown for Children and Adults
Pediatric evaluations rely on growth charts tracking percentiles rather than fixed categories. Children aged 2-19 are compared to peers of the same sex and age group. Adults use fixed thresholds for underweight, healthy range, and obesity classifications.
Interpreting Data and Percentiles
A 60th percentile ranking for a child means 40% of their peers have higher body mass measurements. Adult classifications apply universally but don’t account for muscle density or ethnic variations. “These charts identify trends, not diagnoses,” clarifies a National Institutes of Health report.
Gender-Specific Considerations in BMI
Biological sex influences fat distribution patterns, particularly during puberty and menopause. Male bodies typically store more visceral fat, while females retain subcutaneous reserves. United States health guidelines emphasize using sex-specific charts for accurate risk assessments.
Applying BMI Data for Better Health Management
Turning numbers into action plans requires combining multiple health indicators. While weight-to-height ratios offer a starting point, pairing them with body composition metrics creates clearer pathways for improvement. This approach helps address individual variations in muscle mass and fat distribution.
Integrating BMI With Other Health Measurements
Waist-to-height ratio provides critical context about abdominal fat storage patterns. For every inch over half your height, health risks increase significantly. Body fat percentage measurements through calipers or bioelectrical impedance add depth to basic weight assessments.
Children’s growth patterns demand special attention to percentiles. A 12-year-old girl at the 85th percentile faces different considerations than a boy in the same range. “Combining growth charts with physical activity logs gives families actionable insights,” states data from the National Health and Nutrition Examination Survey.
Using Tools and Calculators to Monitor Progress
Online calculators from national health portals simplify tracking changes over time. These tools automatically adjust for age and biological sex differences. For accuracy:
- Measure height without shoes first thing in the morning
- Use calibrated scales on hard surfaces
- Record measurements monthly for trend analysis
Parents monitoring child BMI should focus on consistent growth trajectories rather than single readings. Many pediatricians recommend using percentile trackers alongside nutrition diaries for children aged 6-18. Digital platforms now sync with fitness wearables to provide real-time feedback about fat loss and muscle gain patterns.
Conclusion
Understanding your body’s needs starts with reliable tools and trusted information. The measurements discussed here serve as foundational markers for tracking progress, but they shine brightest when paired with muscle analysis and lifestyle factors. Our guide emphasizes using these numbers as conversation starters with health professionals rather than standalone verdicts.
Quality calculators and growth charts – especially those accounting for biological sex differences – remain vital references. A recent report confirms that combining weight-to-height ratios with body composition data provides clearer health insights. Always cross-check results with bloodwork, activity levels, and medical history.
We encourage revisiting the charts and digital resources mentioned throughout this guide. While numbers offer direction, personalized care plans deliver real results. Connect with providers to interpret your unique data, using these standardized tools as part of a broader wellness strategy.