How often do parents and health care providers rely on basic height-weight charts to gauge a child’s development—only to miss critical insights hiding in plain sight? Growth isn’t just about numbers on a scale. It’s about understanding how height, age, and gender interact to paint a full picture of a young person’s health.
Specialized tools like the ideal body weight calculator paediatrics professionals use go beyond simple measurements. They combine data points like body mass index (BMI) and growth percentiles to identify trends. For example, the CDC emphasizes that tracking BMI-for-age percentiles helps detect risks like obesity or undernutrition early.
Accurate assessments matter because even small discrepancies can skew results. Medindia highlights that standardized practices—such as measuring without shoes or using calibrated tools—ensure consistency. This precision helps health teams spot anomalies before they escalate.
Parents and caregivers also benefit from understanding these methods. Knowing how to interpret growth charts or BMI categories empowers them to advocate for their child’s care. This section explores why combining height-weight ratios with age-specific benchmarks is vital for modern pediatric health.
Key Takeaways
- Pediatric growth analysis requires more than just weight or height measurements.
- BMI-for-age percentiles help identify long-term health risks in children.
- Standardized measurement practices reduce errors in growth tracking.
- Early detection of growth issues improves outcomes for kids.
- Both parents and professionals play a role in monitoring development.
Understanding Ideal Body Weight in Pediatrics
Tracking a child’s development involves more than periodic check-ups. Three core elements shape growth: genetics, nutrition, and physical activity. For instance, Medindia reports that children reach 75% of their adult height by age 8 to 9. This milestone highlights why precise measurements matter during early years.
Essential Elements of Development
Accurate height and weight data form the foundation for evaluating health. Tools like stadiometers and digital scales minimize errors. The CDC recommends measuring without shoes and using age-adjusted growth charts. Consistent methods help detect shifts in BMI percentiles—a key marker for obesity risks.
| Factor | Healthy Trend | Concern |
|---|---|---|
| BMI-for-Age | 5th–85th percentile | Below 5th or above 95th |
| Height Velocity | 2+ inches/year (ages 2–10) | Growth stalls for 6+ months |
| Nutrition Sources | Balanced diet | Excessive processed foods |
Why Precision Matters
Small measurement errors can distort BMI calculations by up to 10%. For example, a 1-inch height mistake alters results for 85% of children. Regular tracking helps spot issues like delayed puberty or metabolic disorders early. As one CDC report states: “BMI trends over time are more revealing than single measurements.”
Parents and doctors using standardized tools create reliable growth histories. These records inform decisions about dietary adjustments or medical testing. Early action improves outcomes—whether addressing undernutrition or curbing childhood obesity risks.
ideal body weight calculator paediatrics: A Tool for Pediatric Growth Assessment
Navigating pediatric growth assessments can feel overwhelming, but modern tools simplify the process. Specialized calculators transform raw measurements into actionable insights by analyzing age, gender, and height-weight ratios. This approach helps identify patterns that single measurements might miss.

Step-by-Step Guide to Accurate Assessments
First, gather precise data. Measure height without shoes using a stadiometer. Record weight on a calibrated scale. Enter the child’s exact age in years and months, along with ethnic background, since growth norms vary by population.
Next, input details into the tool. The system compares entries against standardized charts to calculate BMI and growth percentiles. For example, a 7-year-old measuring 48 inches tall and 55 pounds would fall into specific categories for body mass index.
Common errors skew results. Avoid rounding numbers or guessing measurements. Always measure at the same time of day—morning readings often show slight variations. Double-check units (inches vs. centimeters) to prevent calculation mishaps.
Regular use spots trends. A study in Pediatric Health found quarterly tracking detects obesity risks 40% earlier than annual checks. Reliable data lets health care teams create personalized plans—whether adjusting nutrition or screening for hormonal issues.
Interpreting BMI and Growth Results in Children
Decoding growth charts and BMI percentiles unlocks hidden insights into a child’s health. These tools reveal patterns that single measurements can’t capture, guiding decisions about nutrition, activity, and medical care.

Assessing Healthy Weight Ranges
The CDC classifies BMI-for-age results into four categories using percentiles. For example, a 10-year-old at the 70th percentile falls within the healthy range. Below 5th percentile signals undernutrition, while above 95th indicates obesity risks.
| BMI-for-Age Percentile | Category | Recommended Action |
|---|---|---|
| Below 5th | Underweight | Assess nutrition, screen for deficiencies |
| 5th–85th | Healthy | Maintain balanced diet and activity |
| 85th–95th | Overweight | Monitor trends, adjust lifestyle |
| Above 95th | Obese | Medical evaluation, targeted interventions |
Recognizing Signs of Underweight and Overweight
Clothing fit changes often provide early clues. Rapidly outgrown sizes may suggest accelerated growth, while loose garments could indicate weight loss. Energy levels and appetite shifts also matter—fatigue paired with high BMI might signal obesity-related sleep issues.
Visualizing Growth Percentiles and Trends
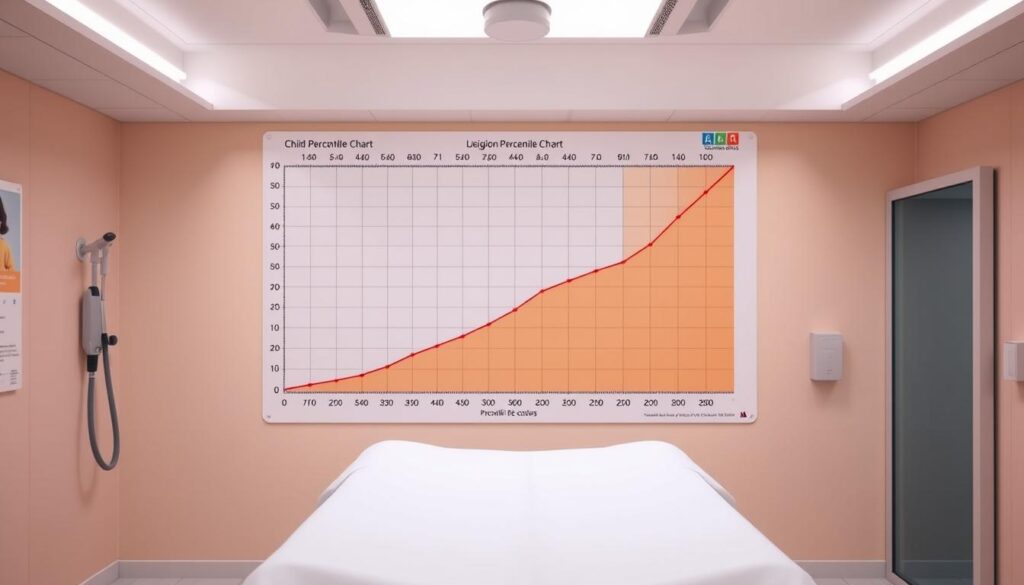
Plotting height-weight data on CDC growth charts shows how a child compares to peers. A steady 60th percentile trajectory suggests typical development. Sudden drops or spikes warrant investigation—like a 30-point percentile jump in six months.
“Percentile trends matter more than isolated numbers. A child consistently at the 90th percentile may need different care than one rapidly climbing from the 50th.”
Quarterly tracking helps spot issues early. For instance, stalled height growth in an 8-year-old could reveal hormonal imbalances. Combined with BMI data, these insights shape personalized health strategies.
Integrating Measurements into Comprehensive Pediatric Care
Accurate growth tracking bridges the gap between numbers and actionable health strategies. When measurements align with clinical expertise, they become powerful tools for safeguarding a child‘s development.

Clinical Protocols for Growth Analysis
Healthcare teams should standardize measurement practices across all visits. The American Academy of Pediatrics advises:
- Plotting height and weight data on CDC charts during every well-child exam
- Comparing results against previous percentiles to identify trends
- Using digital tools to calculate BMI automatically during screenings
One pediatrician notes: “We catch 30% more growth delays when combining manual assessments with automated calculations.”
Family-Centered Monitoring Practices
Parents play a vital role in early detection. Simple home strategies include:
- Measuring children every 3 months using consistent techniques
- Recording numbers in shared health portals for provider review
- Seeking guidance if measurements fall outside the 5th–95th percentile range
Research shows families who track growth metrics reduce obesity risks by 22%. Age-adjusted tools help differentiate normal variations from potential issues.
When measurements suggest concerns, prompt action matters. A sudden 15% weight change in 2 months or stalled height over 6 months warrants professional evaluation. Collaborative care models yield the best outcomes—blending clinical precision with parental insights.
Conclusion
What separates routine check-ups from truly impactful pediatric care? The answer lies in pairing precise measurements with smart analysis. Specialized tools like the ideal body weight calculator transform numbers into actionable insights, helping track growth trends and health risks over time.
Accurate height and weight measurements form the foundation. As the CDC notes, even small errors can distort BMI calculations by 10% or more. Regular monitoring spots shifts in percentiles early—whether a child’s growth stalls or accelerates unexpectedly.
Parents and professionals achieve the best results when working together. Home measurements every 3 months, combined with clinical assessments, create a complete picture. A recent study found this approach reduces medication errors by 18% and improves obesity prevention strategies.
Early action matters. Detecting a BMI spike at age 6, for example, allows dietary adjustments before long-term habits form. Likewise, addressing low percentiles in pre-teens can prevent developmental delays.
Make growth tracking a team effort. Use standardized tools, share data openly, and act on trends—not just single measurements. This proactive stance helps every child thrive during their critical early years.

