Is there a universal formula to determine what your scale should say based on your stature? The answer isn’t as simple as a chart or calculator. While tools like body mass index (BMI) offer general guidelines, they don’t account for muscle density, bone structure, or fat distribution. This complexity is why medical experts emphasize personalized health assessments over rigid standards.
Your body composition plays a critical role in understanding wellness. For instance, athletes often weigh more due to muscle mass but remain metabolically healthy. Similarly, waist-to-height ratios and visceral fat measurements provide deeper insights than basic scales. These factors explain why two people with identical heights can have vastly different health profiles.
Many seek clarity on this topic because societal norms often conflate appearance with well-being. However, research from institutions like the NIH confirms that weight management involves more than numbers—it’s about sustainable habits and holistic health. Our guide will explore science-backed methods to evaluate your unique needs, blending traditional metrics with modern insights.
Key Takeaways
- BMI provides general guidance but doesn’t reflect muscle mass or fat distribution.
- Waist-to-height ratios offer better insights into metabolic risks than weight alone.
- Body composition analysis helps distinguish between muscle and fat percentages.
- Health priorities vary based on age, genetics, and lifestyle factors.
- Medical sources recommend combining multiple metrics for accurate assessments.
Understanding Weight Concepts and Health Indicators
Evaluating health goes beyond stepping on a scale. While numbers matter, they’re just one piece of a larger puzzle. Let’s explore the tools experts use to gauge wellness—and why context matters.

Defining Body Mass Index and Its Role
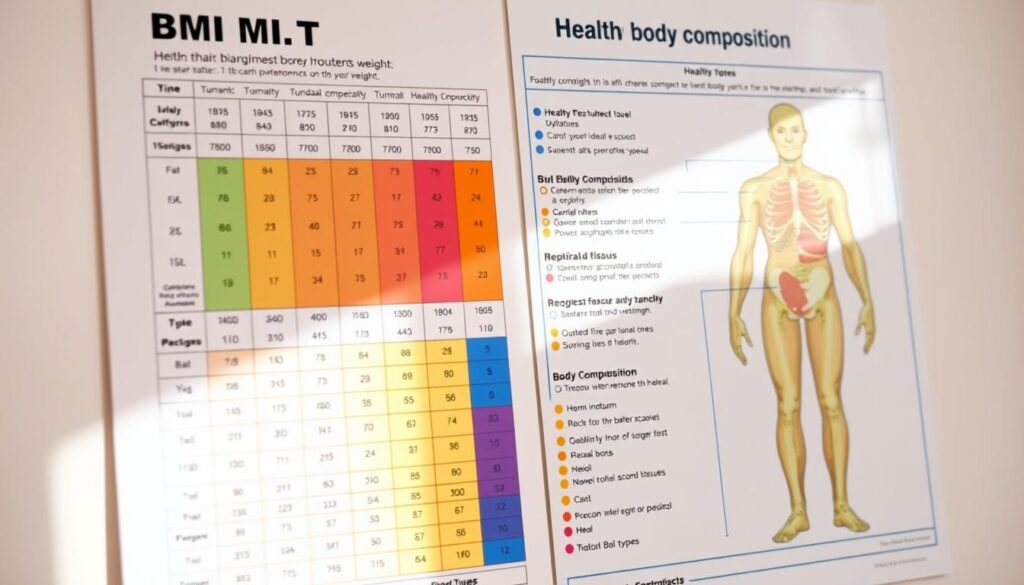
Developed in the 1800s, body mass index (BMI) compares your mass to your height. You calculate BMI by dividing kilograms by meters squared. The CDC classifies results into four categories: underweight, normal, overweight, and obese.
But BMI has flaws. It doesn’t distinguish muscle from fat—a linebacker and someone with high body fat could have identical scores. Age also plays a role, as muscle tends to decrease with time. This is why NIH guidelines suggest pairing BMI with other metrics.
Other Key Measurements: WHR and Body Fat Percentage
Waist-to-hip ratio (WHR) measures abdominal fat, a key predictor of heart disease. Values above 0.9 for men or 0.85 for women signal higher risks. Meanwhile, body fat percentage reveals what scales can’t—how much of your mass comes from fat versus lean tissue.
For example, athletes might have “overweight” BMIs but low fat percentages. Tools like skinfold calipers or bioelectrical scans offer precise readings. These methods help tailor healthy weight management plans to individual needs.
No single metric tells the full story. Combining BMI, WHR, and body fat data gives a clearer picture—especially for people of different ages and lifestyles. Medical News Today emphasizes this multi-metric approach in recent studies.
Calculating Your Ideal Weight: A How-To Process
The journey to understanding your body starts with precise measurements. Even minor errors in tracking can skew results, making tools like BMI calculators less reliable. Let’s explore how to gather data that reflects your true physical metrics.
Steps to Measure Your Height and Weight Accurately
Begin with a calibrated digital scale on a flat, hard surface. Remove heavy clothing and measure at the same time daily—morning readings often provide the most consistent results. For height, stand straight against a wall with heels together, using a book or ruler to mark the top of your head.
Here’s the formula to calculate BMI manually:
- Convert pounds to kilograms (weight ÷ 2.205)
- Convert inches to meters (height ÷ 39.37)
- Square the height in meters
- Divide weight in kilograms by height squared
Common mistakes include measuring on carpeted floors or rounding numbers prematurely. A study in the Journal of Clinical Medicine found that 34% of self-reported measurements had significant inaccuracies affecting BMI categorization.
Consistency matters more than frequency. Track trends over weeks rather than daily fluctuations. As one nutritionist notes:
“Data is only useful if it’s collected with intention and care.”
Pair these methods with body composition tools like smart scales for a fuller picture. Reliable measurements empower you to make informed decisions about health management.
Ideal Weight for My Height: Breaking Down the Calculations
Numbers on a scale often spark curiosity about health, but decoding their meaning requires context. Body Mass Index remains the most widely used measurement tool, despite its limitations. Let’s explore how professionals apply this metric—and why critical thinking matters when interpreting results.

Using BMI to Determine Weight Ranges
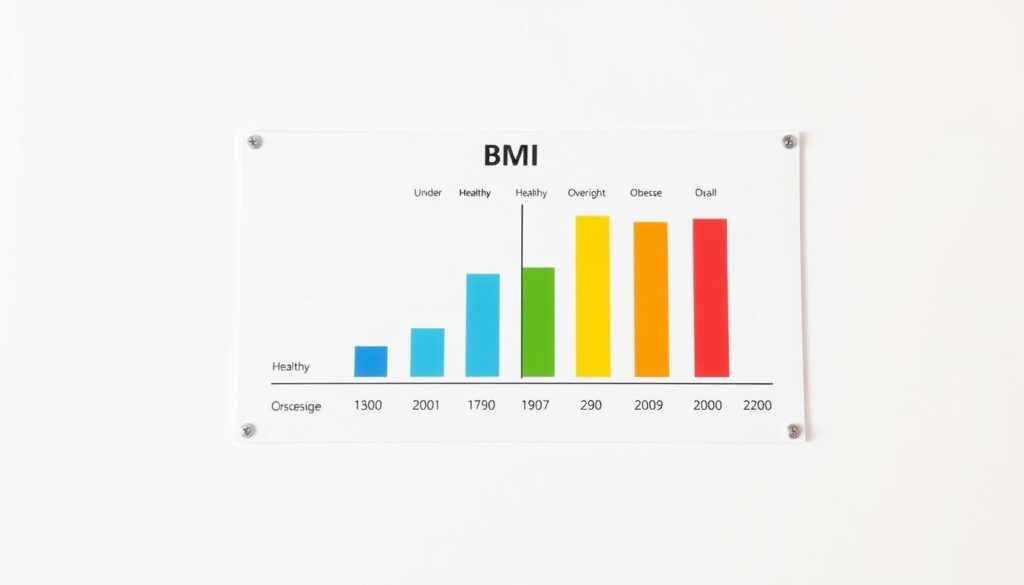
The BMI formula—weight (kg) divided by height (m²)—creates a single number that places individuals into four categories. Organizations like the CDC define these ranges as:
| Category | BMI Range | Health Notes |
|---|---|---|
| Underweight | <18.5 | Potential nutrient deficiencies |
| Normal | 18.5–24.9 | Lower metabolic risks |
| Overweight | 25–29.9 | Increased monitoring advised |
| Obese | ≥30 | Higher cardiovascular risks |
This measurement system works best for populations, not individuals. Athletes with dense muscle mass often land in “overweight” categories despite low body fat. Similarly, older adults may show “normal” scores while carrying excess visceral fat.
Lifestyle factors like activity levels and dietary patterns further complicate interpretations. A construction worker and office clerk with identical BMIs could have vastly different health needs. As the CDC notes:
“BMI should serve as a starting point, not a final diagnosis.”
For personalized insights, pair this online tool with waist circumference checks or body fat analyses. These combined measurements account for variations in bone density and muscle distribution across different ages and lifestyles.
BMI Charts and Weight Ranges by Height
Standardized charts provide snapshots of health ranges, but interpreting them requires nuance. The NIH and CDC categorize individuals into four groups based on BMI calculations. These tools serve as starting points—not absolute verdicts—on metabolic risks.

Interpreting BMI Categories for Health
BMI ranges reflect population-level trends, not individual health. For example:
- Underweight (BMI <18.5): May indicate nutritional gaps
- Normal (18.5–24.9): Associated with lower disease risks
- Overweight (25–29.9): Warrants lifestyle evaluation
- Obese (≥30): Signals need for medical consultation
Body composition dramatically alters interpretations. Dense bone structure or high muscle mass can skew results upward without indicating excess fat.
National Guidelines and Standards
The CDC adjusts recommendations based on sex assigned at birth, as biological differences affect fat distribution. Women generally carry more subcutaneous fat, while men accumulate visceral fat at lower BMIs.
Consider this from NIH research:
“Charts should guide conversations with professionals, not replace personalized health assessments.”
Our interactive tool combines BMI data with body fat percentage metrics for tailored insights. This approach accounts for variations in bone density and muscle-to-fat ratios across different body types.
Additional Tools for Assessing Weight and Health
Health assessments thrive on precision—a single metric rarely captures the full story. While BMI offers a starting point, tools like waist-to-height ratios and body fat analysis reveal hidden risks tied to fat distribution. These methods align with National Institutes of Health guidelines, which prioritize multi-metric evaluations for assessing health risks.

Understanding the Waist-to-Height Ratio
This simple calculation compares your waist circumference to your height. Measure your waist at the narrowest point above the belly button, then divide that number by your height in the same units. Ratios exceeding 0.5 signal elevated metabolic risks, even with a “normal” BMI.
Research from the WHO highlights its value:
“Waist-to-height ratios better predict cardiovascular issues than BMI alone, especially in adults under 60.”
This tool targets visceral fat—the dangerous type surrounding organs. Pair it with our BMI calculator for men to gauge both overall mass and fat placement.
Measuring Body Fat Percentage Effectively
Unlike BMI, body fat percentage distinguishes muscle from adipose tissue. Common measurement methods include:
- Skinfold calipers (3-4% margin of error)
- Bioelectrical impedance scales (home models vary in accuracy)
- DEXA scans (gold standard, used in clinical settings)
Men with over 25% or women above 31% fat face higher diabetes risks, per National Institutes of Health data. Athletes often fall below 20%, explaining why BMI mislabels them as overweight.
Combining these metrics creates a roadmap for sustainable health. Track trends monthly rather than daily, and consult professionals to interpret results within your unique context.
Lifestyle and Health: Influencing Factors on Your Weight
Daily choices shape our bodies more than genetics alone. What we eat, how we move, and even biological factors like sex assigned at birth create a unique health blueprint. Let’s examine how these elements interact to influence metabolic patterns and body composition.
Nutrition, Exercise, and Daily Activity
Balanced meals and consistent movement form the foundation of moderate weight management. Studies show that combining whole foods with 150+ minutes of weekly exercise reduces health risks by 37%. For example:
- Leafy greens and lean proteins stabilize blood sugar
- Strength training preserves muscle mass during weight loss
- Walking breaks counter sedentary job effects
Biological sex also plays a role. Those assigned male at birth often burn calories faster due to higher muscle-to-fat ratios. However, hormonal changes during menopause or andropause can shift these patterns. The WHO emphasizes:
“Tailored strategies beat one-size-fits-all approaches in long-term weight management.”
Small changes yield big results. Swap sugary drinks for water, take stairs instead of elevators, or track steps using smartphone apps. These habits lower visceral fat—a key factor in height ratio assessments—and improve metabolic markers.
Remember, sustainable change thrives on consistency, not perfection. Pair mindful eating with enjoyable activities to build routines that last.
Tools and Resources for Accurate Weight Measurement
Modern technology simplifies tracking health metrics with precision. Reliable digital tools now combine multiple measurements to deliver personalized insights, moving beyond outdated one-size-fits-all approaches.
Online Calculators and BMI Charts
Leading institutions like the NIH and Rush University offer dynamic calculators that analyze body weight, waist size, and activity levels. These platforms update in real-time using national health guidelines, ensuring recommendations stay current with medical research.
Key features of trusted tools include:
- Integration of waist measurements to assess increased risk for metabolic conditions
- Age-adjusted calculations recognizing changing needs over ages years
- Visual charts showing how much fat distribution impacts health outcomes
As noted in NIH resources:
“Digital tools excel at identifying trends—like gradual weight shifts—that single measurements might miss.”
For best results, measure waist size at the same time daily and input data consistently. Pair these resources with professional guidance to determine ideal ranges for your unique physiology. Remember, even minor tracking errors can skew results, so verify inputs against manual measurements monthly.
Conclusion
Health is a puzzle where numbers form just one piece. Throughout this guide, we’ve explored tools like BMI, waist-to-height ratios, and body fat analysis. Each method offers unique insights into assessing health, but none tells the full story alone.
Combining metrics matters. While charts provide snapshots, factors like muscle mass and bone density reshape their meaning. Tracking the amount fat versus lean tissue, for example, clarifies risks that basic scales miss.
Individuality drives outcomes. Activity levels, genetics, and age all influence how numbers translate to wellness. Tools from trusted sources—NIH calculators or DEXA scans—help bridge this gap when used consistently.
We encourage partnering these resources with professional guidance. Assessing health isn’t about hitting arbitrary targets. It’s about understanding your body’s needs through reliable data and sustainable habits.
Remember: the amount fat stored matters less than how it impacts metabolic markers. Prioritize trends over single measurements, and let informed choices guide your journey toward holistic well-being.

