
Is there really a “perfect” number that defines a teenager’s health? While many parents focus on height and weight measurements, the answer isn’t as simple as a single figure. Growth patterns vary widely during adolescence due to factors like bone density, muscle development, and hormonal shifts. Understanding these changes requires more than just a scale—it demands reliable tools backed by science.
We’ll explore how professionals use standardized charts to track physical development over time. These resources, endorsed by organizations like the CDC’s BMI calculator for children and, compare individual measurements to population averages. Body mass index (BMI) serves as a starting point, but it’s only one piece of the puzzle. Muscle mass, genetic background, and activity levels all shape body composition.
Our guide draws from trusted sources including the National Institutes of Health to explain percentile rankings and their role in health assessments. Whether you’re monitoring yearly changes or evaluating overall wellness, this information helps families make informed decisions. Let’s uncover what truly matters when supporting young people through their transformative years.
Key Takeaways
- Growth charts compare individual measurements to age and gender averages
- BMI percentiles help identify potential health risks early
- Multiple factors beyond weight affect body composition
- Annual check-ups track development patterns effectively
- Professional tools provide clearer insights than basic scales
Understanding Growth Charts and BMI for Teens
Decoding a teen’s physical health involves more than just numbers on a scale. Professionals rely on tools like body mass index (BMI) and standardized charts to assess development. These resources help spot trends that might otherwise go unnoticed.

What Is BMI and Why It Matters
BMI calculates body mass using weight and height measurements. The formula (weight ÷ height²) identifies potential fat levels linked to health risks. While not perfect, it’s a practical starting point endorsed by the CDC and National Institutes of Health.
For teens, BMI percentiles matter more than raw numbers. A 75th percentile score means a teen’s measurement exceeds 75% of peers. This helps flag underweight or overweight patterns early, allowing families to adjust nutrition or activity levels.
Comparing Growth Patterns in Teenagers
Boys and girls develop differently during adolescence. Girls often gain fat tissue earlier, while boys build more muscle mass. Growth charts track these shifts by age and gender, showing typical ranges for each stage.
For example, a 14-year-old boy might jump from the 40th to 70th percentile in one year during a growth spurt. These changes are normal but require monitoring through annual check-ups. Percentile charts turn isolated measurements into actionable insights for long-term care.
Using Height and Weight Charts Effectively
Navigating growth charts requires understanding their core elements. These tools transform raw numbers into actionable insights about physical development. Let’s break down how they work and why consistent tracking matters.

Key Components of Growth Charts
Standard charts display three critical measurements: height, weight, and BMI. Percentile rankings compare these figures to national averages for the same age and gender. Dual measurement systems (feet/inches and centimeters) accommodate global health standards.
| Component | Purpose | Measurement Units |
|---|---|---|
| Percentiles | Shows relative position vs peers | 0-100 scale |
| Height | Tracks skeletal growth | Inches/cm |
| BMI | Assesses body composition | kg/m² |
Monitoring Changes Over Time
Measure every 3-6 months to spot trends. Sudden jumps or drops in percentiles may signal health shifts. For example:
- A teen moving from 50th to 85th BMI percentile in 8 months needs evaluation
- Consistent below-10th percentile height rankings could indicate nutritional gaps
Use digital tools like the CDC’s growth chart calculator to simplify recordings. Pair measurements with notes about puberty stages or activity changes. This context helps doctors distinguish normal development from potential concerns.
Ideal Weight for Teens: Growth Chart Guide
Growth charts become powerful tools when you know how to read their language. We’ll walk through interpreting these visual guides to assess physical development confidently.

Navigating the Guide for Accurate Assessment
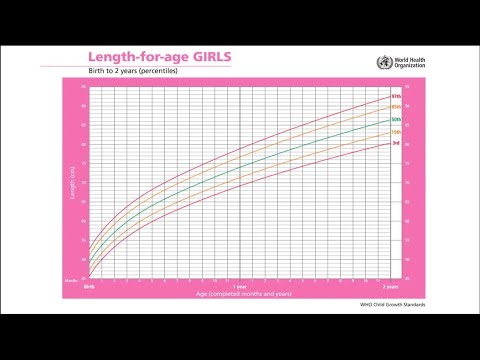
Start by locating your teen’s age on the horizontal axis. Match it with their current height or weight measurement on the vertical scale. The intersecting point reveals their percentile ranking compared to peers.
Percentiles tell a story beyond numbers. A 60th percentile body mass index score means 60% of similar-aged individuals measure lower. “Consistent tracking matters more than single measurements,” notes a CDC growth chart manual. Record findings every 6 months to identify patterns.
Consider these key elements when evaluating results:
- Parallel movement of height and weight curves over years
- Sudden 20+ percentile jumps in body mass
- Consistent below-5th percentile rankings in weight-age comparisons
Digital tools like the CDC’s clinical growth chart calculator simplify analysis. Input measurements to generate automatic percentile rankings. Pair this data with notes about puberty stages or sports participation for context.
When charts show unexpected changes, consult pediatricians. They’ll assess bone development, muscle composition, and family history to determine if adjustments are needed. Charts provide direction—experts offer personalized navigation.
Step-by-Step Measurements for Accurate Results
Precision matters when tracking physical development during adolescence. Even minor errors in height or weight recordings can skew percentile rankings on growth charts. We outline proven methods endorsed by healthcare providers to ensure reliable data collection.

Accurate Height Measurement Techniques
Use a flat wall without baseboards for consistency. Have the teen stand straight with heels together, looking forward. Place a hardcover book vertically against their head, marking the wall where it meets the highest scalp point. Measure from the floor to the mark using a metal tape for exactness.
Reliable Weight Measurement Tips
Digital scales on firm flooring yield the best results. Remove shoes and heavy jackets before stepping on. Record numbers to the nearest 0.1 kg (or 0.25 lbs) for medical-grade precision. Measure at the same time daily—morning readings after using the bathroom minimize natural fluctuations.
| Tool | Purpose | Best Practices |
|---|---|---|
| Flat wall | Ensures vertical alignment | Check for slanted surfaces |
| Digital scale | Provides precise readings | Calibrate monthly |
| Metal tape | Measures height accurately | Avoid cloth tapes |
Track changes every three months using standardized tools. The CDC recommends this interval to spot trends without over-monitoring. Consistent methodology helps doctors distinguish normal growth patterns from potential concerns.
Interpreting the Data: What Growth Charts Mean
The true value of growth charts lies in recognizing long-term patterns rather than isolated numbers. These visual tools help spot early signs of nutritional imbalances or developmental shifts that might affect overall health.
Identifying Underweight and Overweight Trends
Percentile rankings reveal critical information. A BMI-for-age below the 5th percentile suggests underweight status, while scores above the 85th percentile indicate overweight risks. For example:
- A 12-year-old girl at the 3rd percentile needs nutritional evaluation
- A 16-year-old boy at 92nd percentile may require activity adjustments
| BMI Category | Percentile Range | Recommended Action |
|---|---|---|
| Underweight | <5th | Assess dietary intake |
| Healthy | 5th-85th | Continue monitoring |
| Overweight | 85th-95th | Increase physical activity |
| Obese | >95th | Medical consultation |
When to Consult Healthcare Professionals
Schedule a doctor’s visit if measurements show:
- Consistent decline across height-weight percentiles
- BMI crossing two major percentile lines in 6 months
- Disproportionate growth between body mass and bone structure
“Persistent outliers require expert analysis,” states a CDC guideline. Combine chart data with blood tests or bone age scans for complete assessments. Early intervention prevents long-term issues like metabolic disorders or stunted development.
Conclusion
Tracking physical development relies on more than guesswork—it demands precise tools and clear data interpretation. Standardized growth charts paired with BMI calculator results offer families actionable insights into body composition trends. Consistent measurements of height and weight, taken every 3-6 months, reveal patterns that single numbers can’t capture.
Understanding percentile shifts helps identify early health signals. A teen’s BMI-for-age ranking crossing two major lines within six months warrants professional consultation. These changes might reflect natural growth spurts or deeper concerns needing attention.
Annual check-ups transform raw data into preventive care strategies. Doctors analyze bone structure, muscle mass, and genetic factors alongside chart trends. This holistic approach ensures developmental milestones align with individual potential.
We encourage families to view these tools as partners in health—not replacements for medical expertise. Regular monitoring builds awareness, while expert guidance turns data into lasting well-being. Thank you for prioritizing informed decisions in nurturing healthy futures.