 Skip to content
A BMI chart for men and women uses the same standard adult category boundaries. It matches height and weight to a screening number; it does not produce a sex-specific diagnosis or an ideal body shape. CDC adult categories apply from age 20 onward.
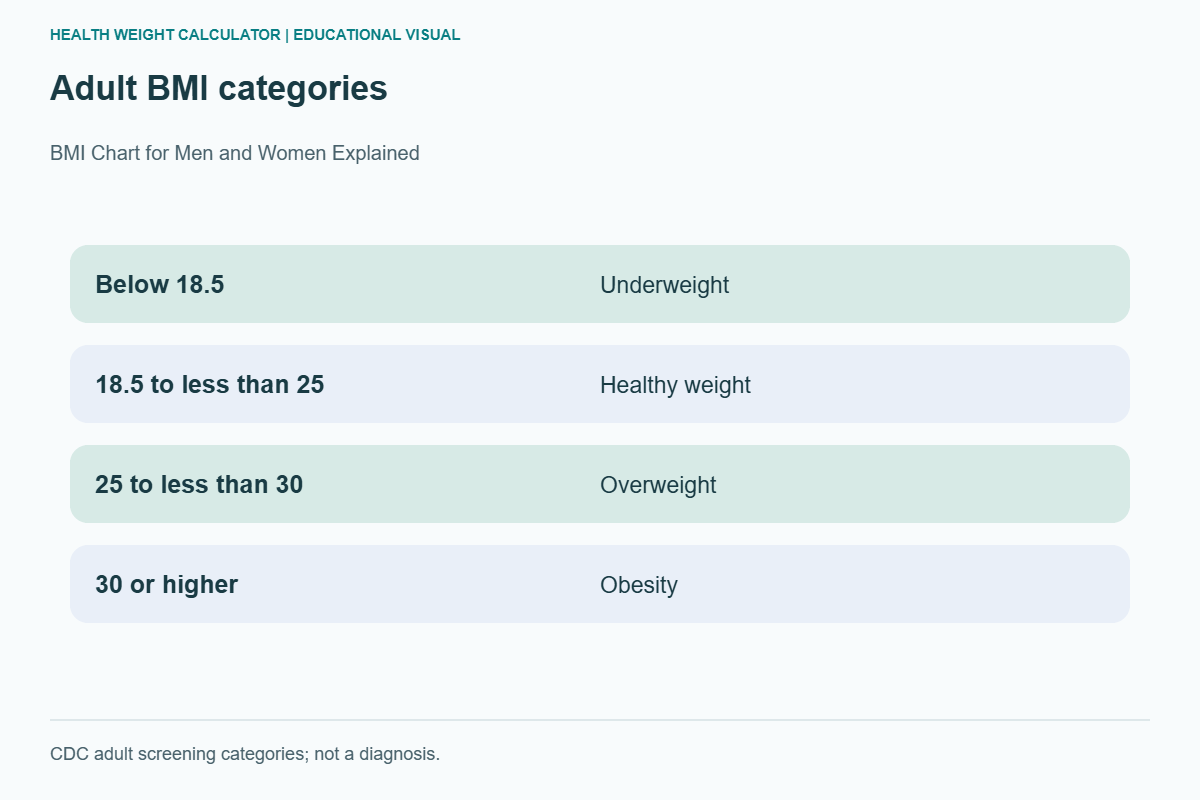
The adult chart, without ambiguous boundaries
| BMI | CDC screening category |
|---|---|
| Below 18.5 | Underweight |
| 18.5 to less than 25 | Healthy weight |
| 25 to less than 30 | Overweight |
| 30 or higher | Obesity |
Exactly 25 belongs to the overweight category; exactly 30 belongs to obesity. Do not mix up a rounded display with the unrounded calculation. The chart describes categories, not a guarantee of health or illness.
Find the right height-and-weight intersection
Suppose an adult is 1.70 m tall and weighs 72 kg. Squared height is 2.89, giving BMI 72 / 2.89 = 24.91. At the same height, the BMI 25 boundary corresponds to 72.25 kg. A very small change crosses the chart line without representing a dramatic change in health.
On a printed chart, check whether height is shown along the top or side and whether weight is in pounds or kilograms. An inches-versus-centimetres mistake can make the answer meaningless.
Why the same chart does not mean identical risk
BMI cannot distinguish fat from muscle or describe fat distribution. Age, ethnicity, medicines, pregnancy, and medical conditions may influence the clinical assessment. A clinician may use additional measures or different action thresholds under local guidance; do not silently substitute those into a chart labelled as the CDC standard.
Chart questions
Should women use a different adult BMI formula?
The standard formula is the same. Individual health assessment is more detailed than the chart.
Can I use the chart during pregnancy?
Current pregnancy weight needs obstetric interpretation. Do not use the chart as a pregnancy weight-loss target.
Sources and further reading
Related reading: adult BMI chart and interpretation. Educational information, not a diagnosis or a personalized treatment plan.
Short visual recap
Visual recap transcript
A BMI chart for men and women uses the same standard adult category boundaries. It matches height and weight to a screening number; it does not produce a sex-specific diagnosis or an ideal body shape. CDC adult categories apply from age 20 onward.
Adult BMI categories. Below 18.5|Underweight; 18.5 to less than 25|Healthy weight; 25 to less than 30|Overweight; 30 or higher|Obesity. CDC adult screening categories; not a diagnosis.
The standard formula is the same. Individual health assessment is more detailed than the chart.
